Devpost
Participate in our public hackathons
Devpost for Teams
Access your company's private hackathons
Grow your developer ecosystem and promote your platform
Drive innovation, collaboration, and retention within your organization
By use case
Blog
Insights into hackathon planning and participation
Customer stories
Inspiration from peers and other industry leaders
Planning guides
Best practices for planning online and in-person hackathons
Webinars & events
Upcoming events and on-demand recordings
Help desk
Common questions and support documentation
Sort by:
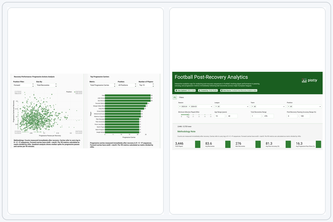
One app that turns Europe’s top-league event data into instant insights on player & team performance right after winning possession.
Colon cancer is on the rise. I whipped up a Dash app with the help of Plotly Studio to combat colon cancer through healthy diet.
A visual story of Gen Z's career shift from traditional jobs to the creator economy, told through 15 years of public search data.
"Seamless travel meets smart analytics — powered by A2A Protocol."
State-wise insights on literacy, schooling, youth, and menstrual hygiene supporting SDGs 3, 4, 5, 6. Spot gaps, compare states, and drive better outcomes for women, children, and future generation.
A dashboard with eight components looking at the wellbeing scores for countries in different ways. Users can compare countries and values and see which ones, overall, have the best and worst scores.
AI-powered insights revealing what truly makes nations prosper
AI prototype that triages hospital notes, giving clinicians instant insights, urgency scores, and audio summaries to help them prioritize care.
Smartwatches track our bodies. Oceanpulses track's Earth's. Using AI and global satellite Data, it monitors marine heatwaves, gas leaks, temperature distribution. The life signs of our planet.
From Data to safer Roads: The AI-powered dashboard that maps accident risk by condition, curvature, and speed limit for smarter public safety planning.
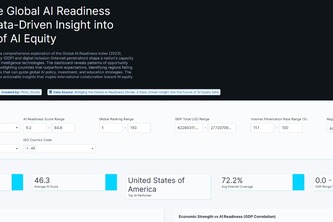
Bridging the AI Readiness Divide visualizes how GDP and digital access shape nations’ AI adoption, revealing gaps, top performers, and insights for a more inclusive AI future.
Exploring Different Sides of Compute Tradeoff: How does changing training config impact energy consumption?
Environmental Quality Explorer An interactive data app visualizing how OECD nations perform on key environmental well-being metrics like green space access, air pollution, and climate exposure.
InsightMesh is a multi-agent BI engine using Claude APIs to turn plain questions into instant insights and interactive graphs, making data talk clearly, fast, and without complex dashboards.
Planetrics transforms NASA's exoplanet data into a stunning visual journey. Discover and explore over 6,000 confirmed worlds with our interactive dashboard.
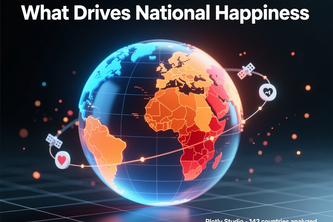
Interactive dashboard analyzing 143 countries to reveal what drives national happiness. Features derived metrics and multi-dimensional visualization showing social capital matters more than GDP.
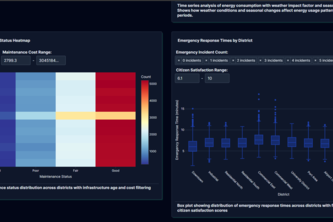
Smart City Infrastructure Monitor gives city leaders real-time insights, predictive alerts, and data-driven decisions—cutting failures, saving costs, and improving lives.
Quantifying the $1.6 trillion annual cost of global digital exclusion to help governments and NGOs prioritise connectivity investments for maximum economic impact.
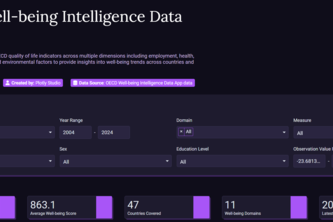
The 'OECD Well-being Intelligence App' uses a striking purple theme, 6 analytical charts, and 8 global filters to deliver deep 'Purple Intelligence' into health, safety, and employment disparity.
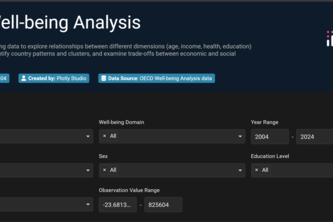
“I built a Plotly app that makes OECD well-being data interactive, showing patterns and country comparisons with advanced charts.”
Data-driven insights for continuous improvement — visualize defects, monitor process stability, and measure real Six Sigma gains across manufacturing lines with interactive analytics.
From pay to wellbeing, see where people—and businesses—thrive: six linked charts that reveal opportunity, risk, and momentum.
OECD Wellbeing Explorer: an interactive dashboard to compare countries, view wellbeing profiles, and explore links across health, jobs, education, and environment.
Interactive health data app for identifying nutritional deficiencies and discovering optimal food sources to address specific nutrient gaps in diets.