-
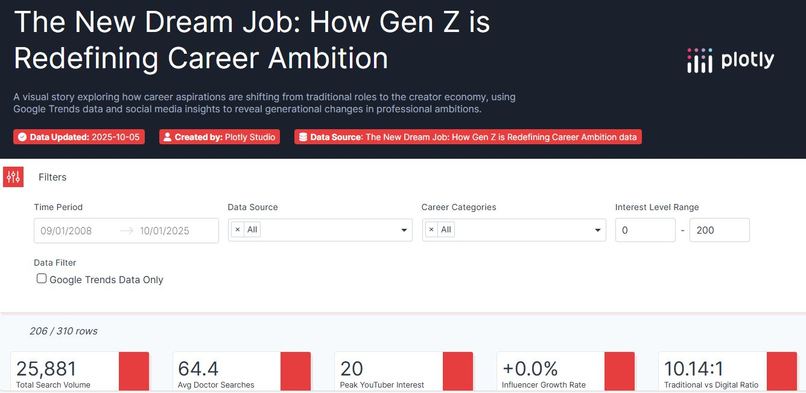
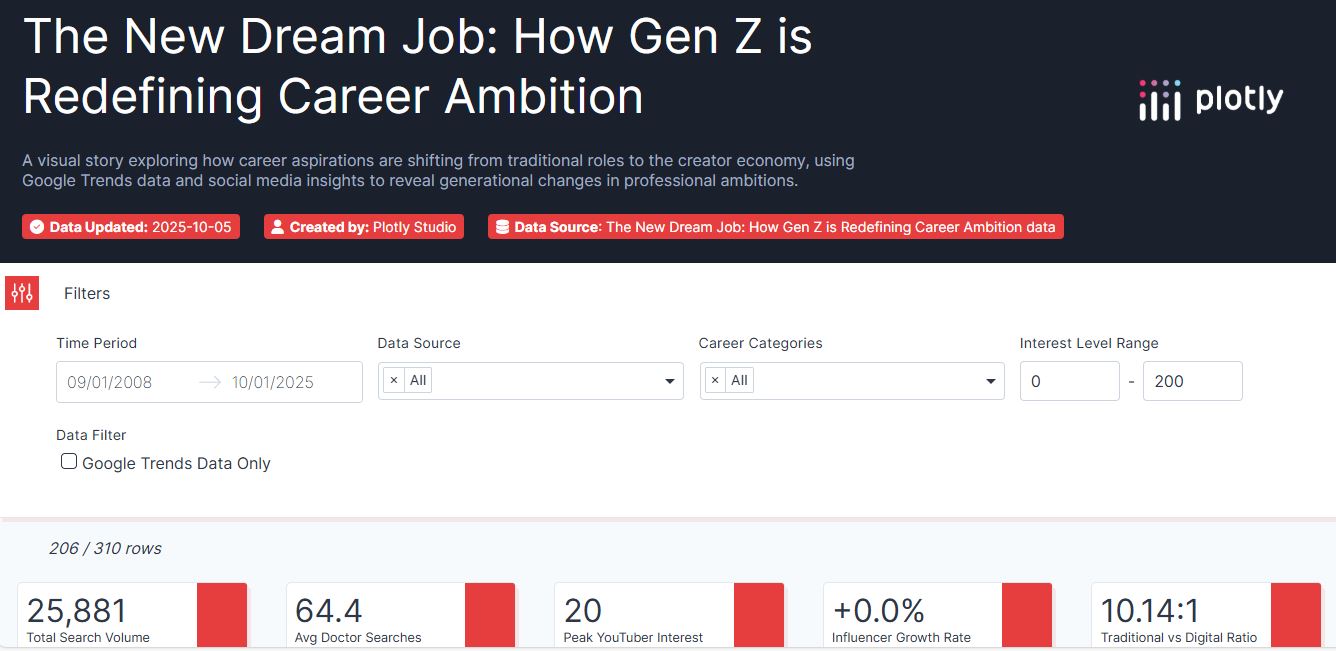
The New Dream Job
-

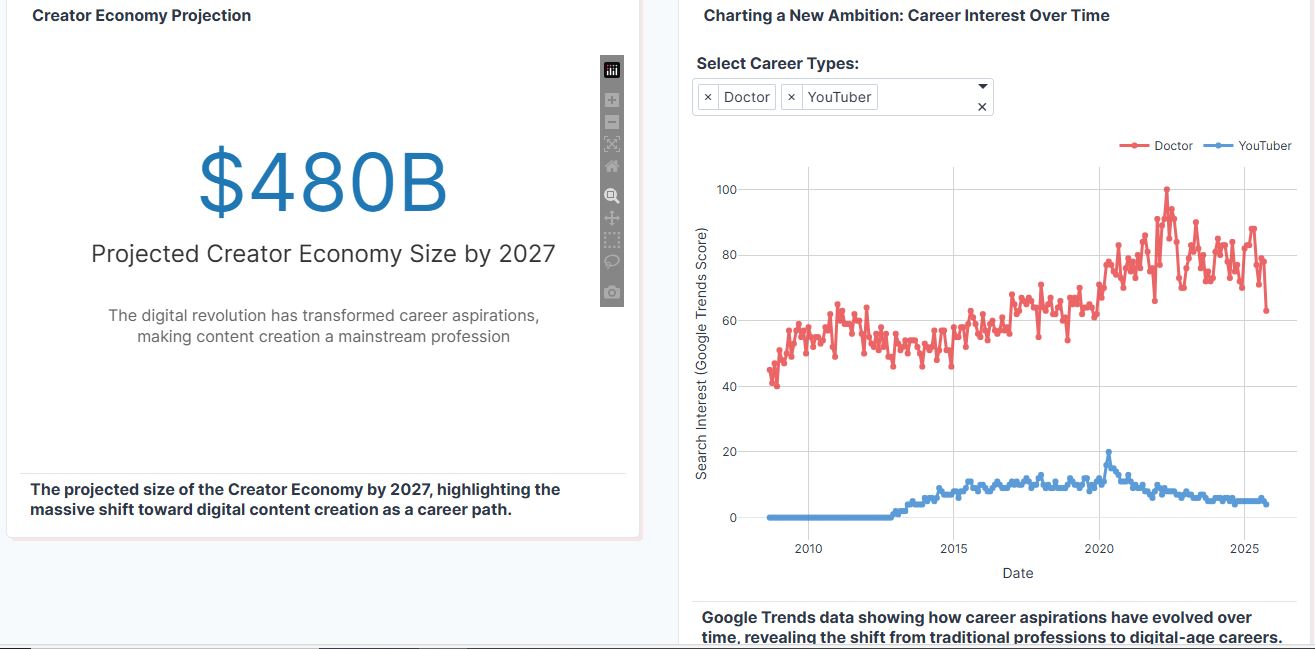
Creator Economy Projection
-

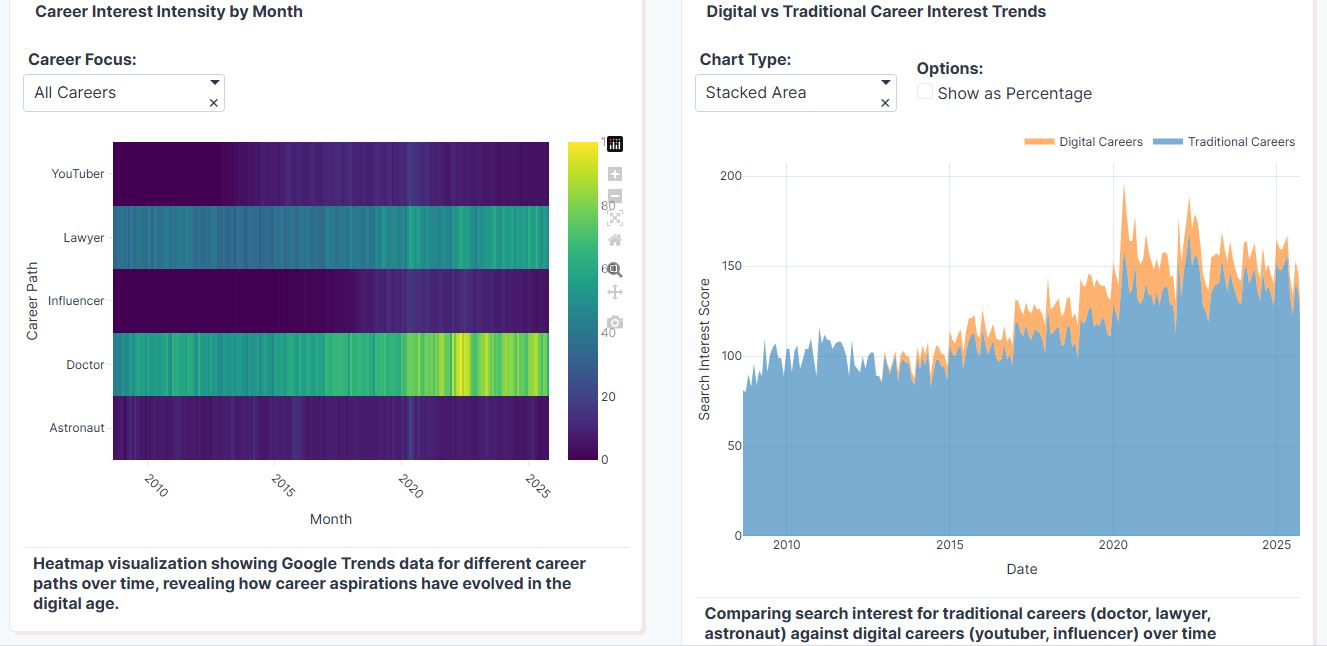
digital vs traditional career interest trends
-
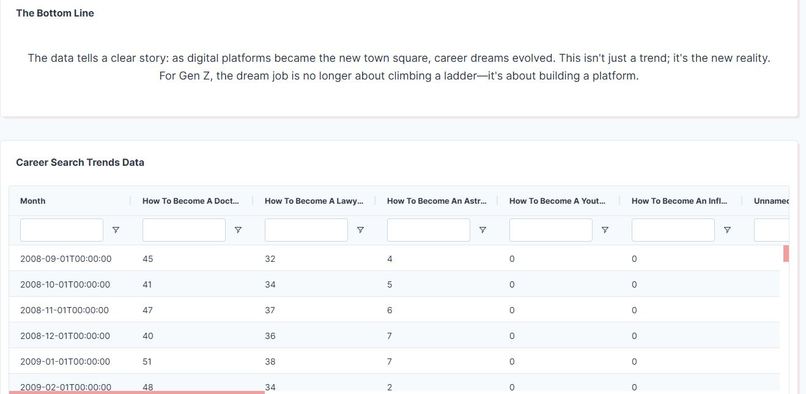
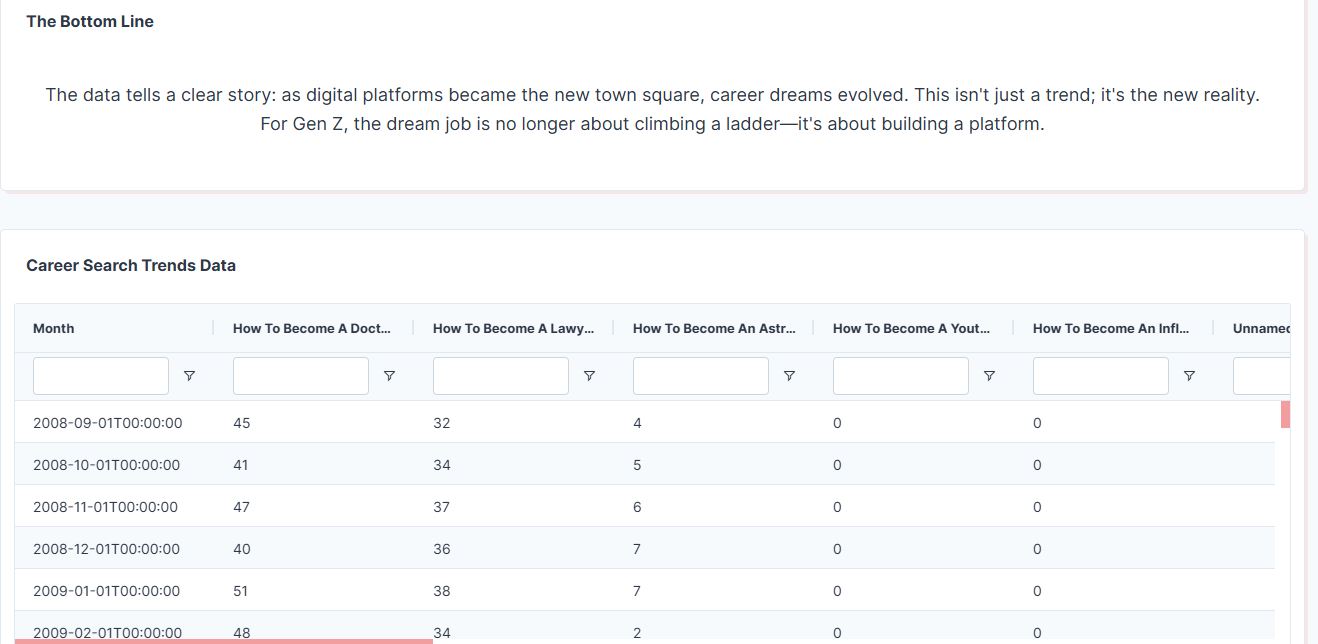
the Bottom Line
The Inspiration
I was inspired by the rise of the creator economy and wanted to see if this cultural shift was reflected in the data. I hypothesized that public interest in becoming a YouTuber or influencer has been growing, while interest in traditional high-status jobs might be changing. I wanted to create a data app to explore this trend and tell the story of a generation's changing ambitions.
What It Does
My app guides the user through a three act narrative. It begins with a hook that is a striking statistic on the size of the creator economy. Then, it presents the core evidence which is an interactive line chart that visualizes the change in Google search interest for careers like doctor versus YouTuber over the past 15 years. Users can interact with the chart by selecting different career paths and filtering by date to see the trends for themselves. The story concludes with a summary of this profound generational shift.
How I Built It
This app was built entirely using Plotly Studio, leveraging its AI powered, low code platform to design the interface and generate visualizations. The data is a combination of a public Google Trends export and a Kaggle dataset on social media usage, which were merged and cleaned before being uploaded. The final app is deployed on Plotly Cloud.
Challenges I ran into
- One of the main challenges was combining two distinct datasets into a single, usable file for Plotly Studio and still after combining it the social media usage data was not found after making the app so had to remove the graph.
- I was not able to correct Created By bar as it is showing Created by Plotly studio instead of my name and Data Source bar( will definitely keep in mind for future work).
- I wanted to change the position of the Bottom Line text as it appears before the Career Search Trend Data but failed to do so.
What I learned
Through this project, I learned how to use Plotly Studio to quickly build a narrative driven data application, and I gained experience in the important process of cleaning and preparing data for analysis.
Built With
- cloud
- plotly
- studio


Log in or sign up for Devpost to join the conversation.