Devpost
Participate in our public hackathons
Devpost for Teams
Access your company's private hackathons
Grow your developer ecosystem and promote your platform
Drive innovation, collaboration, and retention within your organization
By use case
Blog
Insights into hackathon planning and participation
Customer stories
Inspiration from peers and other industry leaders
Planning guides
Best practices for planning online and in-person hackathons
Webinars & events
Upcoming events and on-demand recordings
Help desk
Common questions and support documentation
Sort by:
I built this app to make studying abroad simpler, compare tuition, living costs & scholarships in one place. More affordable study-abroad choices with just a few clicks.
Illuminating unseen patterns in a world shadowed by fear.
Find your ideal country. This interactive app lets you explore global well-being and discover nations that excel in the quality-of-life areas you care about most.
On the basis of data gathered, the app does analysis and provides valuable insights about the data patterns and their co-relations. Along with gist and suggestion for improvement.
Ready to be amazed at how much can now be done using Plotly to squeeze out every bit of information from your data — all in a time frame that almost feels like a joke?
OECD Well-being: Track the World's Progress, Domain by Domain.
Let's explore OECD Wellbeing Data
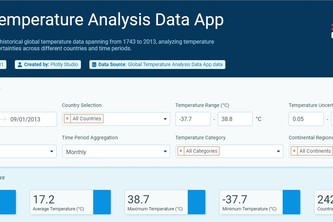
See the planet's fever chart come to life—interactive climate storytelling that makes centuries of global warming visually undeniable.
Linking mobility, environment, and wellbeing through data.
the AI model compass, charting the course for your AI strategy.
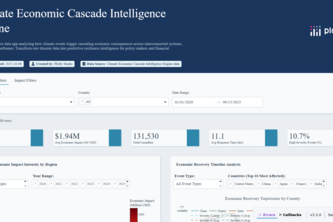
Revolutionary AI dashboard revealing hidden economic cascade patterns in climate disasters, transforming 3,000+ global events into predictive resilience intel.
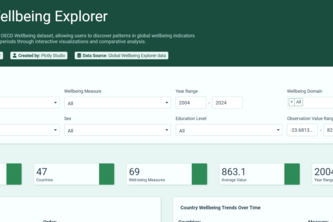
This data app explores the OECD Wellbeing dataset, allowing users to discover patterns in global wellbeing indicators across countries and time periods.
An interactive Plotly Dash app that brings trust to life by visualizing Mint → Verify → Attest → Seal events as a living graph of verifiable identity.
Decoding the global workforce, one data point at a time.
Explore 40 years of U.S. billion-dollar disasters.
DataSky Protype App uses NASA Earth observation sample data to calculate the likelihood of extreme heat, rain, wind, or uncomfortable weather.
My Spotify-powered behavioral analytics pinpoints listener shifts via time-series analysis, enabling proactive strategy to reduce skip rates and mitigate churn.
This is my first contribution on DEVPOST.
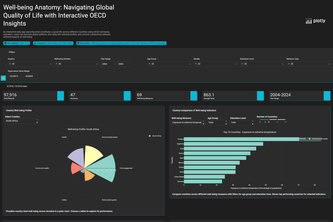
Well-being Anatomy is an interactive platform using OECD data to explore global quality of life through visualizations, comparisons, and demographic insights.
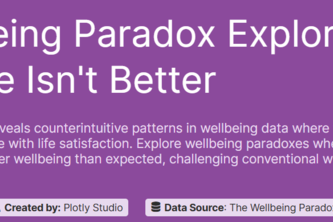
An interactive tool exploring why success doesn't always equal happiness. Uncover the surprising paradoxes hidden in global wellbeing data and challenge conventional wisdom.
Tariff Tracker: Making global trade make sense.
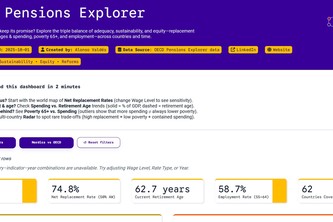
Will your pension keep its promise? Explore the triple balance of adequacy, sustainability, and equity replacement rates, retirement ages & spending, poverty 65+, and employment across countries.
An interactive COVID-19 dashboard built with Plotly, visualizing cases, deaths, and trends across countries with line, bar, and pie charts.
Real-time monitoring and analysis of critical patient vital signs including heart rate, oxygen levels, and temperature to support healthcare professionals in emergency and routine care situations .