-
-
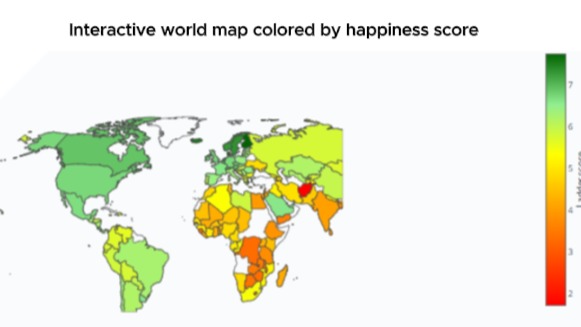
Interactive World Map Colored By Happiness Score
-

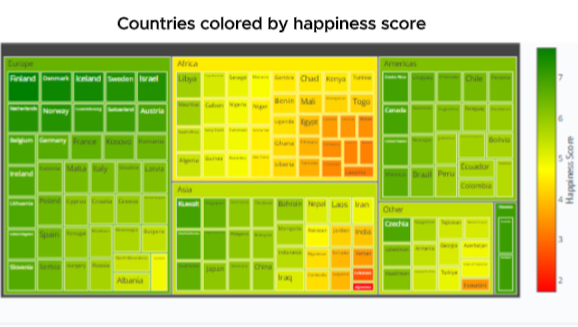
Countries Colored By Happiness Score
-
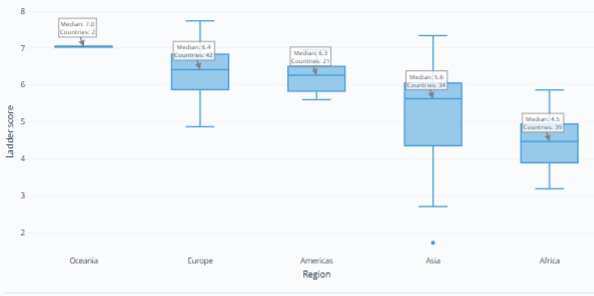
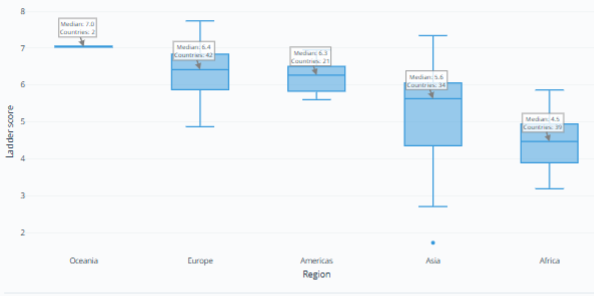
Happiness Score By Region Box Plots
-

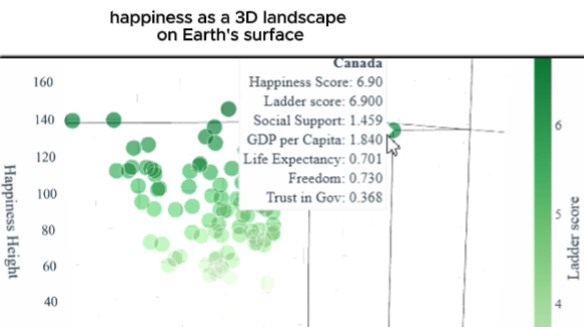
Happiness Factors as a 3D Landscape on Earth's Surface
-

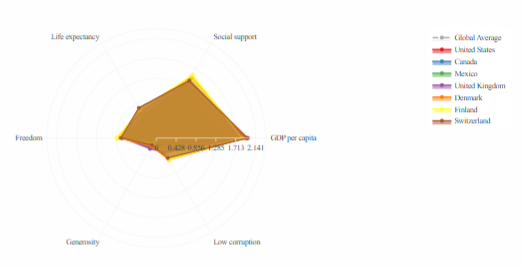
Multi-Country Radar Comparison
-

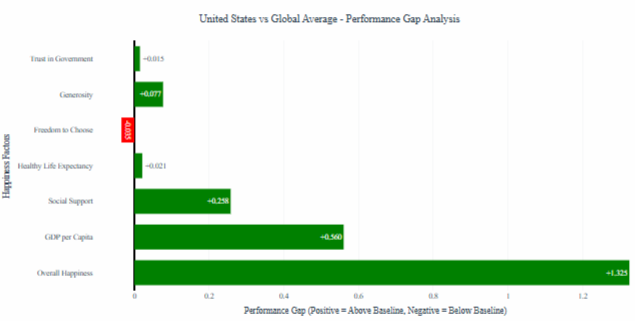
Performance Gap Analysis
-

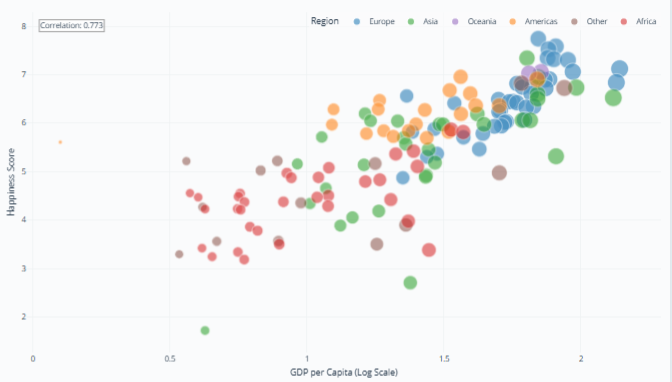
GDP vs Happiness Relationship
-
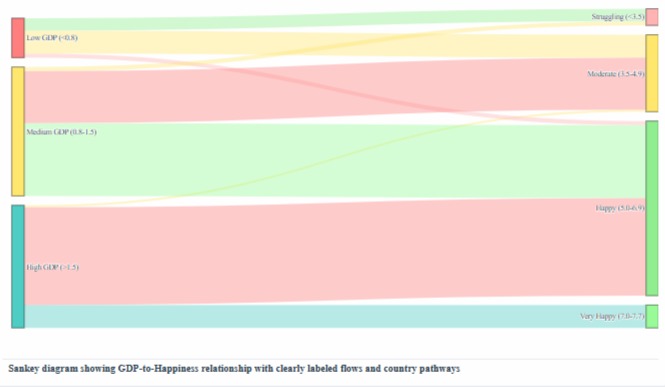
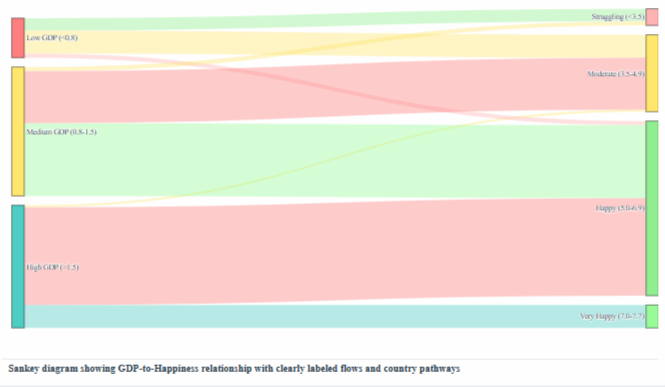
GDP-to-Happiness Relationship
-

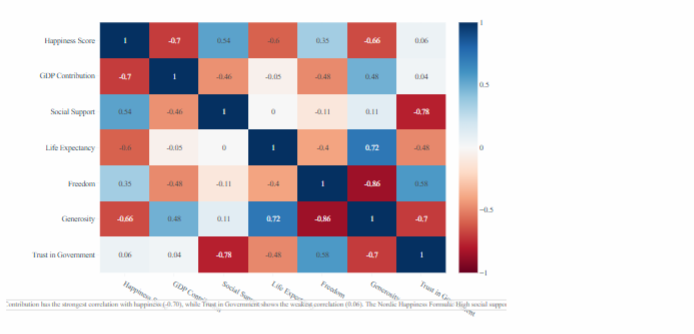
Correlation matrix relationships between Happiness Score and wellbeing factors
-

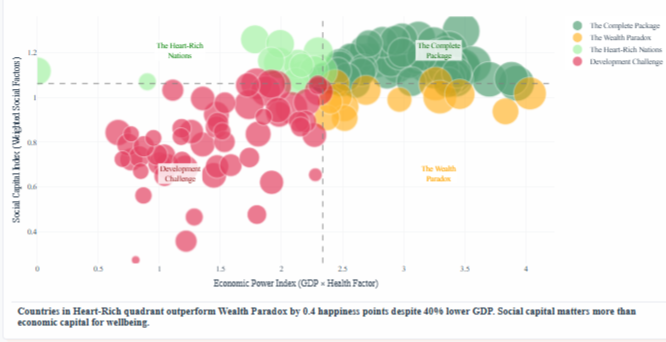
Social Capital vs Economic Power Quadrant Matrix

Inspiration
The World Happiness Report ranks countries by wellbeing, but raw rankings don't tell the full story. Why does Costa Rica (#12) outperform much wealthier nations? Why do Nordic countries consistently dominate despite different economic models? This project digs deeper to understand the mechanisms behind happiness differences and make findings actionable for policymakers.
What It Does
This dashboard transforms the 2024 World Happiness Report into an explorable analytical tool with 10 interconnected visualizations:
- Dataset Used : https://www.kaggle.com/datasets/ajaypalsinghlo/world-happiness-report-2024
- Geographic exploration: Choropleth maps and treemaps reveal where happiness concentrates globally
- Country benchmarking: Radar charts and performance gap analysis allow direct comparisons
- Factor analysis: Correlation matrices and scatter plots show GDP, social support, life expectancy, freedom, generosity, and government trust relationships
- Deep Insight: Introduces Social Capital Index, Economic Power Index, and Happiness Efficiency Score to reveal patterns hidden in raw data
Key finding: Countries in the "Heart-Rich Nations" quadrant (high social capital, modest GDP) achieve 0.4 points higher happiness than "Wealth Paradox" countries (high GDP, low social capital) - proving social bonds matter more than economic output.
How We Built It
Data Processing:
- Cleaned and validated 143 countries from World Happiness Report 2024
- Calculated derived metrics:
- Social Capital Index = (Social Support × 0.6) + (Trust × 0.3) + (Freedom × 0.1)
- Economic Power Index = GDP × (1 + Life Expectancy/0.85)
- Happiness Efficiency = Happiness Score / (GDP + Social Support)
- Normalized all metrics to consistent scales for fair comparison
Visualization Strategy:
- Organized 10 charts into 4 thematic sections progressing from overview to insights
- Implemented cross-chart filtering so selecting a country updates all visualizations
- Used consistent regional color coding (Europe blue, Americas orange, Asia green, Africa red, Oceania purple)
- Added red-yellow-green gradients for performance indicators
Technology:
- Built entirely in Plotly Studio leveraging its AI-powered chart generation
- Iterated on auto-generated visualizations to add correlation coefficients, trend lines, and quadrant annotations
- Implemented global filters affecting all charts simultaneously
Challenges We Faced
Plotly Studio Limitations:
- 3D visualizations rendered poorly (flat projections instead of true WebGL)
- Auto-generated layout didn't allow manual reordering, so worked within constraints by using descriptive titles
Data Interpretation:
- Derived metrics needed validation - tested formulas against known patterns (Nordic countries should score high across all indices)
- Balancing statistical rigor with accessibility for non-technical audiences
Analytical Decisions:
- Choosing weights for Social Capital Index (60% social support, 30% trust, 10% freedom) based on correlation strength with happiness
- Defining quadrant thresholds for Economic Power vs Social Capital matrix using median splits
- Deciding which countries to label on dense scatter plots without cluttering
What We Learned
Data Science Insights:
- Social support correlates with happiness (r=0.75) more strongly than GDP (r=0.79 but with diminishing returns)
- Latin American countries achieve disproportionate happiness through strong social bonds despite modest GDP
- Nordic success isn't about any single factor - it's balanced excellence across ALL six dimensions
- The relationship between wealth and happiness plateaus around GDP contribution of 1.5
Technical Skills:
- Advanced Plotly techniques: parallel coordinates, custom color scales, multi-layered annotations
- Effective data storytelling through complementary visualizations that build on each other
- Importance of derived metrics - raw data alone misses efficiency and capital type patterns
- Balancing interactivity with simplicity so charts enhance understanding rather than overwhelm
Design Principles:
- Every chart needs a clear "so what?" - don't visualize data just because you can
- Consistent color coding reduces cognitive load and makes patterns instantly recognizable
- Hover tooltips should show complete context, not just one metric
- Global filters must affect ALL charts to maintain coherent narrative across dashboard
What's Next
Immediate Enhancements:
- Add temporal analysis if multi-year data becomes available (track how countries improve/decline)
- Implement scenario simulator showing projected happiness if countries improve specific factors
- Create downloadable policy reports with country-specific recommendations
Advanced Features:
- Machine learning model predicting happiness from factor combinations
- Causal inference analysis (does social support CAUSE happiness or just correlate?)
- Cost-effectiveness analysis: happiness gain per dollar invested in each factor
Broader Impact:
- Share findings with policymakers in countries scoring below expectations for their GDP level
- Develop country-specific dashboards for governments to track progress on wellbeing factors
- Create public awareness campaign: "happiness isn't about being rich, it's about social bonds"
- Expand to other wellbeing datasets (OECD Better Life Index, Sustainable Development Goals)
This project demonstrates that data visualization isn't just about making charts - it's about revealing actionable insights that can improve lives. The finding that social capital compensates for modest economic resources gives hope to developing nations: you don't need to be wealthy to be happy, you need strong communities.


Log in or sign up for Devpost to join the conversation.