-
-

Smart City Infrastructure Monitoring System Dashboard
-

Smart City Infrastructure Monitoring System Dashboard
-
Smart City Infrastructure Monitoring System Dashboard
-
Smart City Infrastructure Monitoring System Dashboard
-

Smart City Infrastructure Monitoring System Dashboard


🔧 About the Project: Smart City Infrastructure Monitor
🌟 Inspiration
As someone with a strong background in embedded systems and a deep love for electronics, I’ve always been drawn to the idea of making cities smarter through sensor-driven intelligence. I imagined a future where thousands of embedded devices could work together to give city managers a real-time pulse of urban life. That vision inspired me to build the Smart City Infrastructure Monitor—a platform that turns raw sensor data into actionable insights.
📚 What I Learned
This project was a crash course in scaling embedded concepts to city-wide analytics. I learned:
- How to simulate large-scale sensor networks using synthetic data
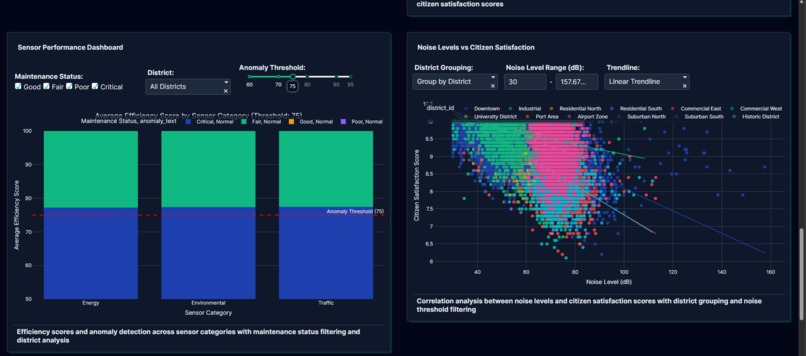
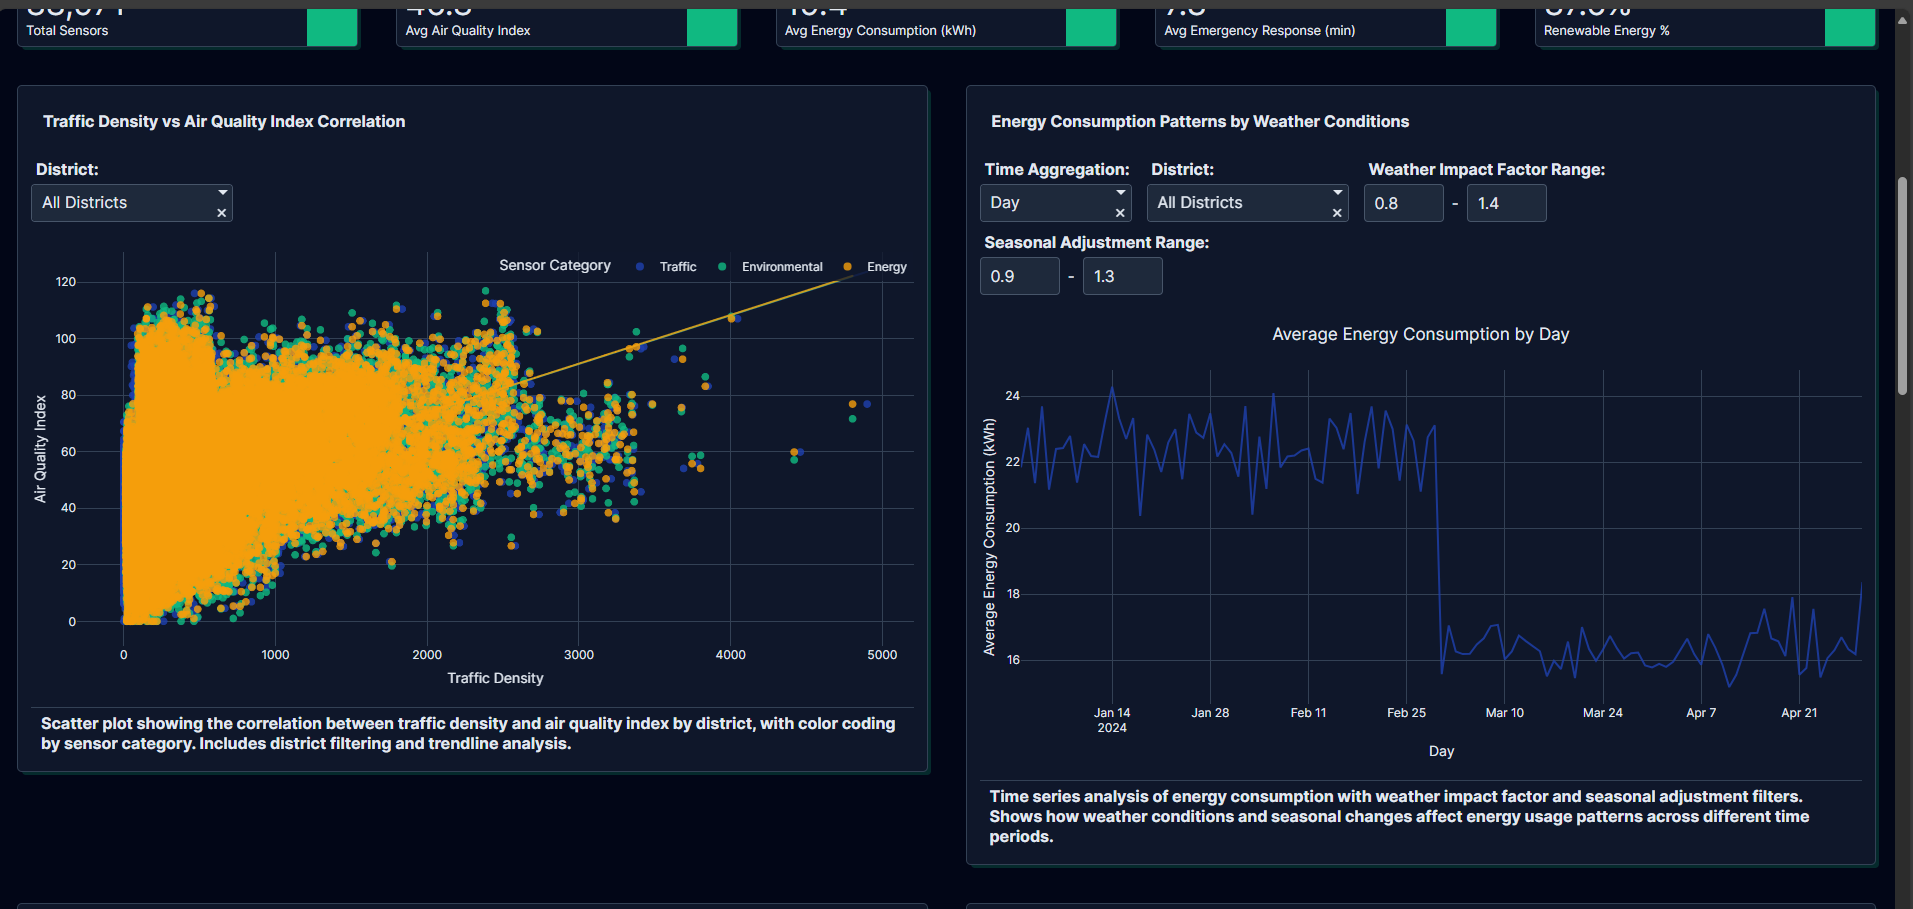
- How urban metrics like traffic, pollution, and emergency response are interconnected
- How to apply correlation analysis and predictive modeling to infrastructure data
- How to design intuitive dashboards that communicate complex data clearly
I also explored how environmental variables interact, such as:
$$ \text{Air Quality Index (AQI)} \propto \text{Traffic Density} $$
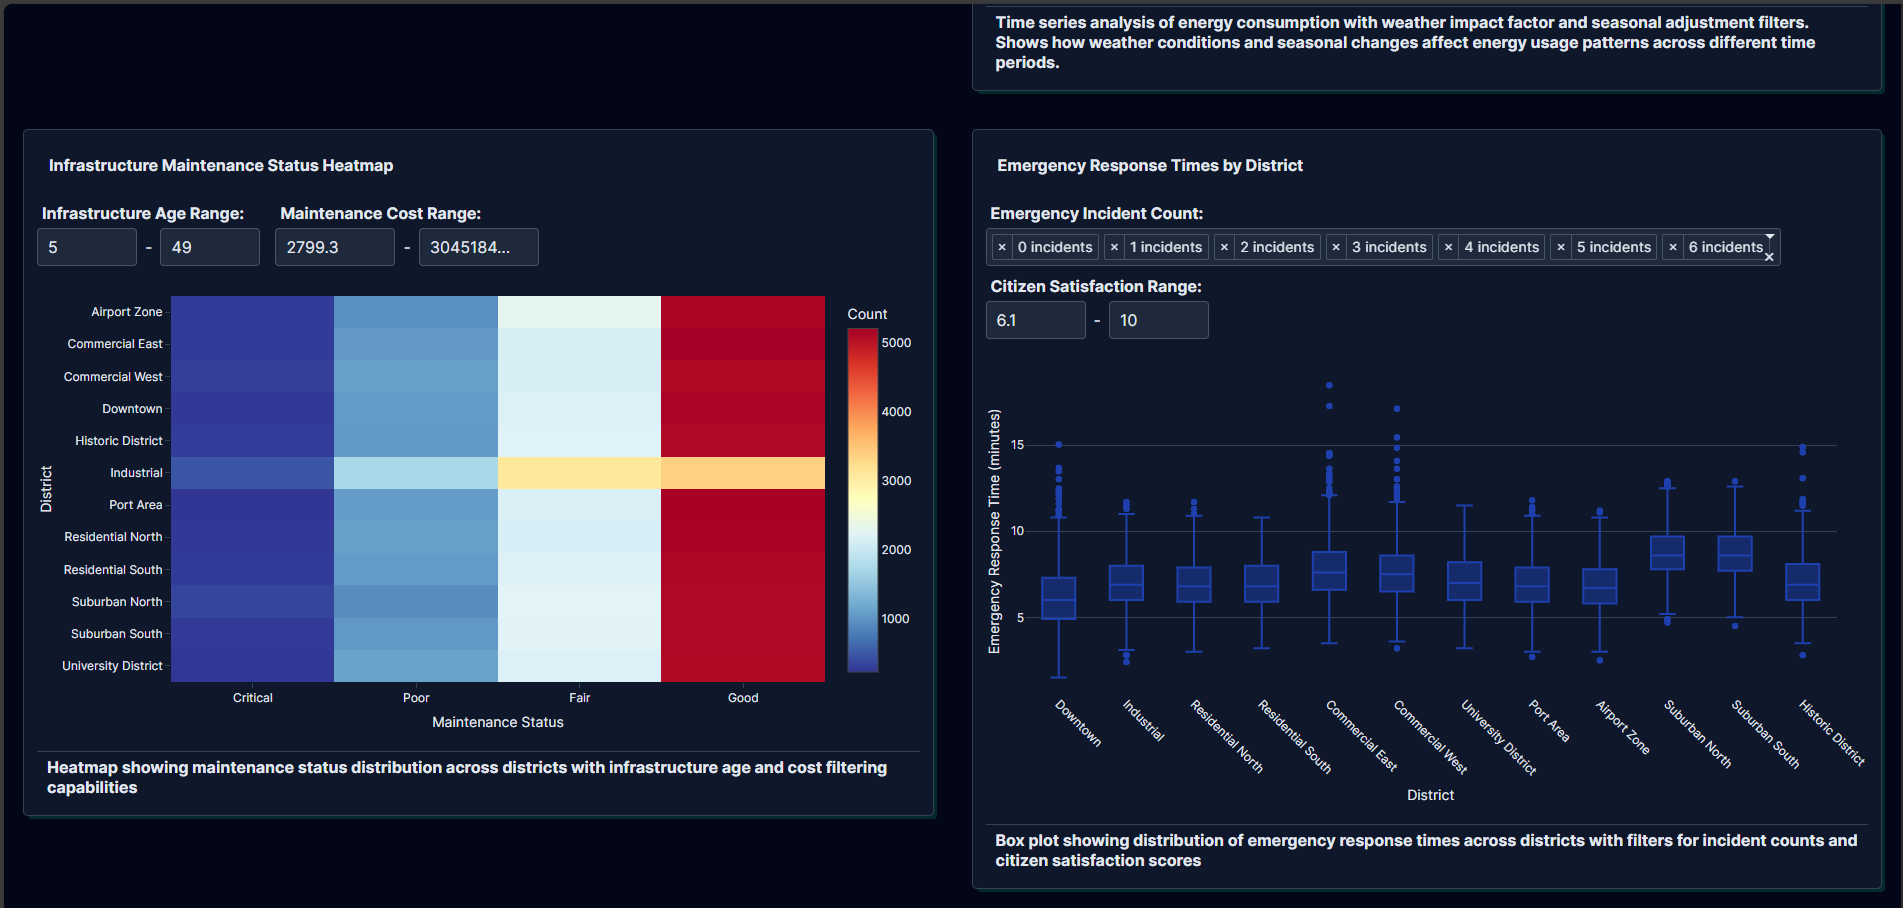
and how predictive maintenance can be modeled using:
$$ \text{Failure Risk} = f(\text{Infrastructure Age}, \text{Usage}, \text{Efficiency Score}) $$
🛠️ How I Built It
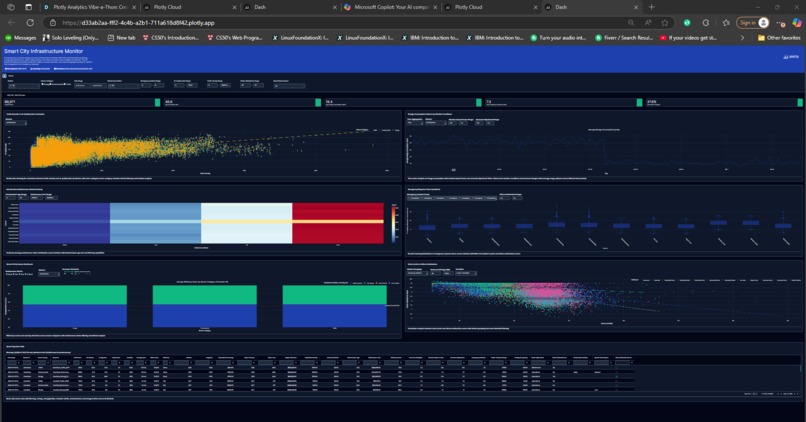
- Data Generation: I created a synthetic dataset simulating 88,971 sensors across 12 districts, capturing metrics like air quality, energy usage, and emergency response times.
- Visualization & Analytics: Everything else—from dashboard design to correlation plots, heatmaps, and predictive models—was built entirely in Plotly Studio. It handled the data ingestion, visualization logic, and UI layout seamlessly.
- Architecture: The project is modular, with separate views for city health, infrastructure risk, emergency response, and environmental impact.
🚧 Challenges Faced
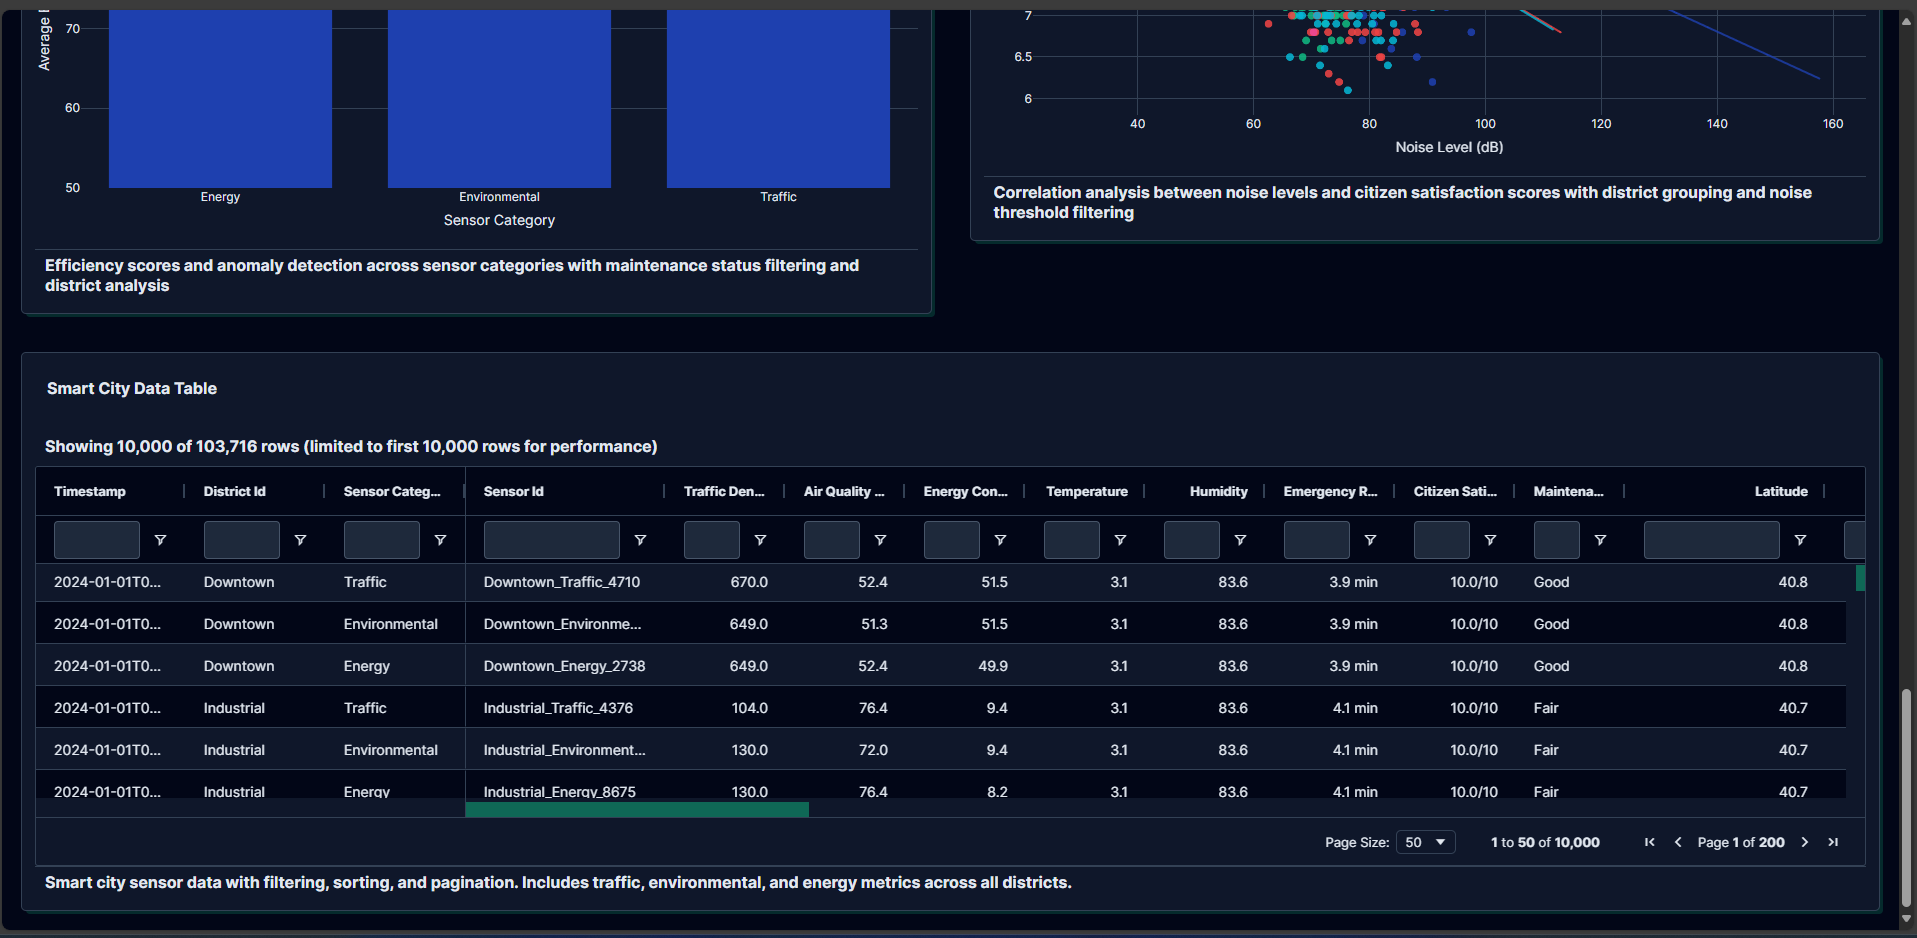
- Data Volume: Managing over 103,000 rows of data pushed the limits of browser-based visualization.
- Correlation Complexity: Finding meaningful relationships across 33 metrics without noise or false positives was tricky.
- Predictive Modeling: Designing algorithms that forecast infrastructure failure required careful tuning and validation.
- Interface Design: Balancing technical depth with visual clarity took multiple iterations.
🚀 Final Thoughts
This project was a perfect blend of my embedded systems foundation and my passion for electronics. It showed me how hardware-inspired thinking can scale into full-fledged smart city solutions. With Plotly Studio handling the heavy lifting, I was able to focus on the core logic and storytelling—turning data into decisions, and decisions into impact.


Log in or sign up for Devpost to join the conversation.