Devpost
Participate in our public hackathons
Devpost for Teams
Access your company's private hackathons
Grow your developer ecosystem and promote your platform
Drive innovation, collaboration, and retention within your organization
By use case
Blog
Insights into hackathon planning and participation
Customer stories
Inspiration from peers and other industry leaders
Planning guides
Best practices for planning online and in-person hackathons
Webinars & events
Upcoming events and on-demand recordings
Help desk
Common questions and support documentation
Sort by:
An interactive COVID-19 dashboard built with Plotly, visualizing cases, deaths, and trends across countries with line, bar, and pie charts.
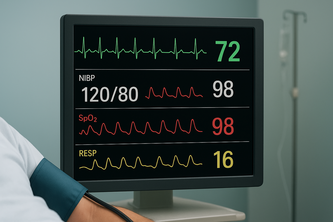
Real-time monitoring and analysis of critical patient vital signs including heart rate, oxygen levels, and temperature to support healthcare professionals in emergency and routine care situations .
PROTECT YOUR INTELLECTUAL PROPERTY
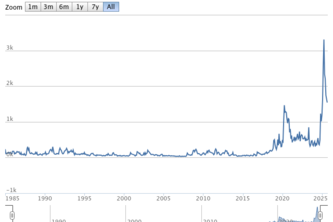
Discover undervalued, overhyped, and leading tokens in real time with interactive visualizations powered by Plotly Dash.
Comprehensive analysis of YouTube channel performance metrics including revenue, engagement, viewership patterns, and content optimization insights across video publishing timeline.
An interactive Plotly app that uncovers global CO₂ emission trends, comparing countries and decades to reveal patterns shaping our climate future.
A data app analyzing gender gaps in education, employment, health, and wellbeing across OECD countries to promote women’s empowerment through insights.
FDA INTELLIGENCE DASHBOARD
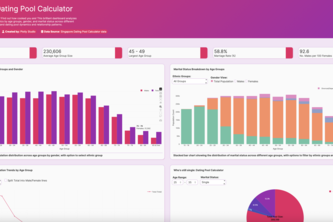
Haven't found a bf/gf yet? This brilliant dashboard analyzes Singapore's population demographics to help YOU understand dating pool dynamics and relationship patterns.
CorpWell Trends helps HR teams fight burnout & boost retention by personalizing employee well-being insights.
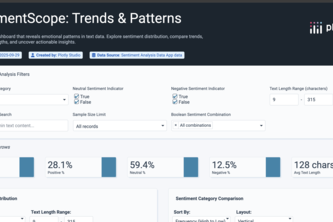
An interactive dashboard that reveals emotional patterns in text data. Explore sentiment distribution, compare trends, analyze word lengths, and uncover actionable insights.
Optimizing accessibility investments by prioritizing stations with the highest ridership, failures, and community vulnerability.
Instead of drowning in spreadsheets to comment on a student's performance, you get clear, interactive dashboards that reveal trends, strengths, and areas that affect their grades.
Forget currency. How many minutes of work does a coffee really cost in London versus Delhi?
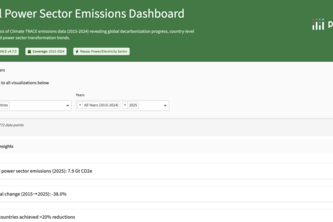
Introducing the anti-doom-scrolling app! We use Climate TRACE data to spotlight measurable climate WINS in the global power sector and key industries, translating CO2 cuts into real-world impact.
Not all bias is loud-some whispers. This dashboard helps you hear it.
This project uses the agentic AI tools of Plotly to get information from the Economic Policy Uncertainty index. The index is a way to measure people's uncertainty of the future using NLP techniques.
An open-source, physics-informed AI that cleans noisy medical signals, turning untrustworthy data from wearables and clinics into confident, life-saving diagnoses for heart and brain conditions.
FinSync: Conversational AI for personal finance using Google Cloud Vertex AI (Gemini 2.5 Pro) & Elastic hybrid search (BM25+kNN). Upload statements, ask questions, get instant insights with citations.
A powerful analytics dashboard that tracks engagement, retention, and growth in AI text humanization apps, delivering insights to drive adoption and performance.
Explore OECD wellbeing across countries, domains, and demographics and see who’s smiling!
A comprehensive data app for exploring well-being indicators across countries, demographics, and time periods with statistical comparisons and distribution analysis.
HealthScope: A vibrant, modern dashboard that visualizes health data to reveal patterns in age, risk, and disease. Designed for clarity, insight, and smarter healthcare decisions.
Provide information of call and put premium option prices based on spot prices, market volatility, and other related factors using the Black-Scholes model.