-
-
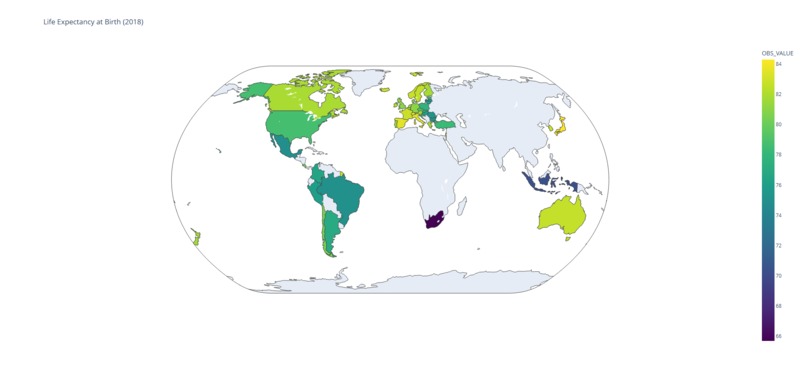
Life Expectancy at birth (2018)
-
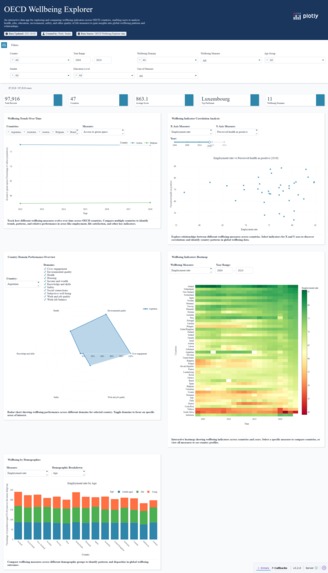
Main DashBoard


Inspiration
The inspiration behind this project came from the OECD Better Life Index, which provides a comprehensive view of well-being across countries. I wanted to create a tool that allows users to explore these insights interactively, understand the factors contributing to life satisfaction, and make data-driven comparisons between nations.
What it does
This project provides an interactive dashboard that lets users:
- Compare countries based on well-being indicators like health, education, income, and environment.
- Visualize trends over time and across regions.
- Identify correlations between different indicators using charts, maps, and heatmaps.
- Calculate custom scores using weighted indicators, e.g.,
[ \text{Custom Score} = \sum_{i=1}^n w_i \cdot x_i ]
where ( w_i ) is the user-defined weight for indicator ( i ), and ( x_i ) is the normalized value for that indicator.
How we built it
The project was built using:
- Python & Pandas: For data cleaning and preprocessing.
- Plotly & Dash: To create interactive charts, maps, and dashboards.
- Jupyter Notebook: For exploratory data analysis.
- CSV/JSON APIs: To fetch OECD datasets dynamically.
The workflow involved:
- Collecting and cleaning OECD data.
- Normalizing and transforming indicators for comparability.
- Developing interactive visualizations to explore insights.
- Integrating these visualizations into a cohesive dashboard. ## Challenges we ran into
- Data inconsistencies: Different countries report indicators with varying frequencies and units, requiring normalization.
- Handling missing data: Some countries lacked recent data for certain indicators.
- Interactive performance: Large datasets caused lag in the dashboard, which we optimized using caching and filtering.
Accomplishments that we're proud of
- Successfully built a fully interactive dashboard with multiple visualization types.
- Enabled users to create their own custom well-being scores.
- Made OECD data more accessible and understandable for non-experts. ## What we learned
- The importance of clean, normalized data when comparing international metrics.
- How to design user-friendly dashboards that convey insights clearly.
- Techniques for handling missing or inconsistent data in large datasets. ## What's next for Living Better: OECD Insights
- Add predictive analytics to forecast well-being trends.
- Introduce more granular regional data within countries.
- Allow users to simulate policy changes and see their potential impact on well-being indicators.
- Incorporate machine learning to identify patterns and clusters among countries based on life satisfaction.

Log in or sign up for Devpost to join the conversation.