-
Overview of my project
-
-
-
-
-
-

-

-
-
-
-


Inspiration
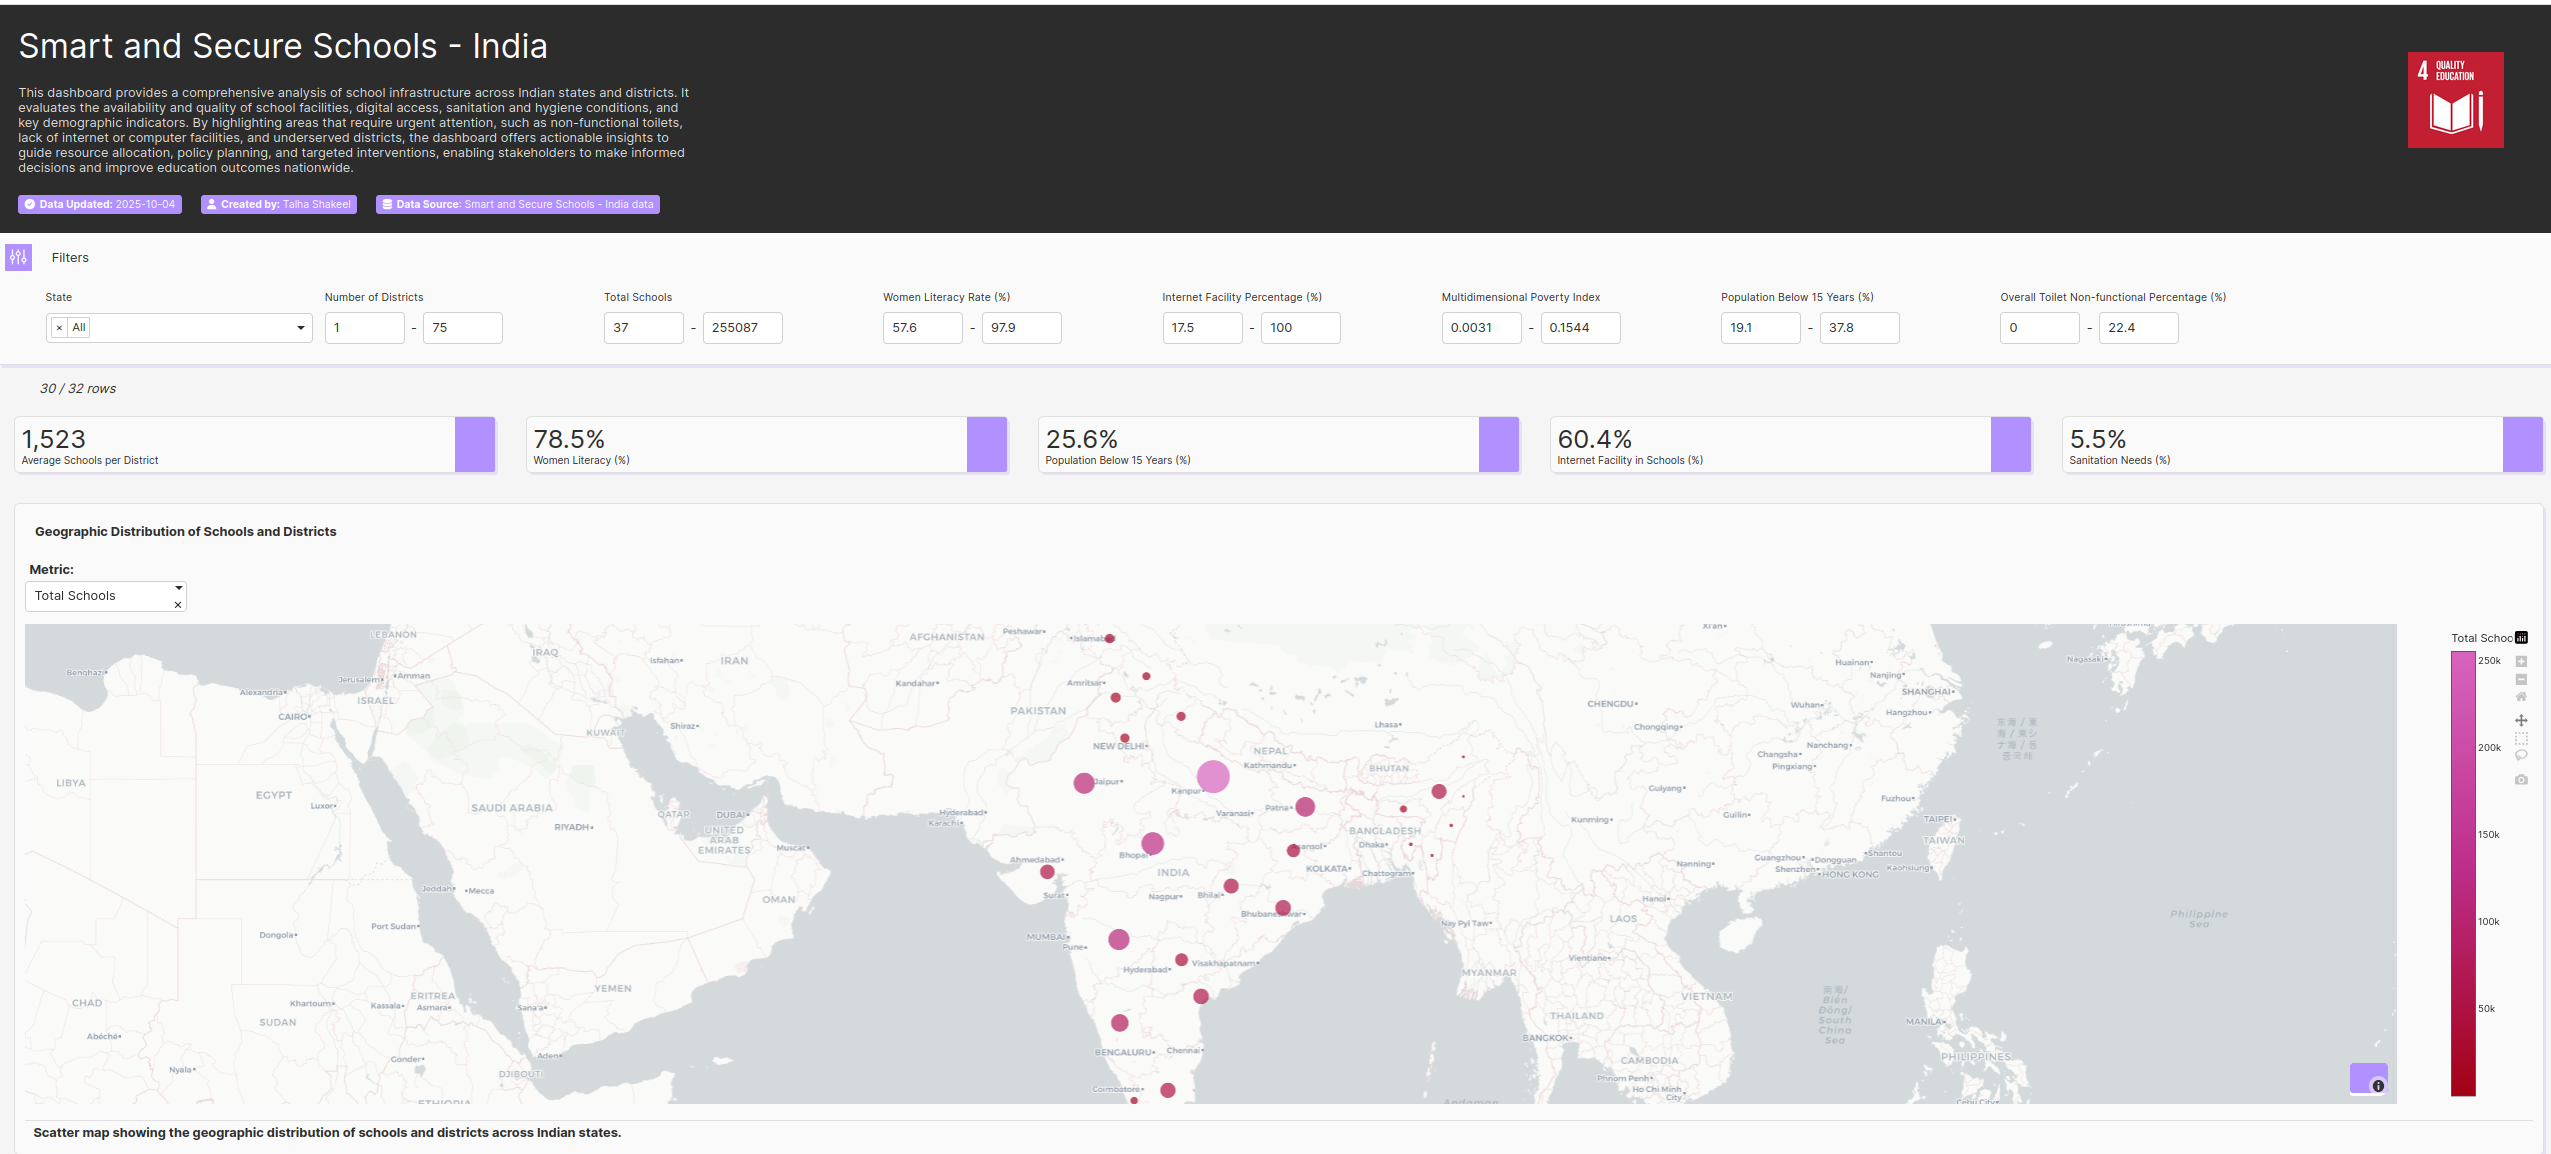
I wanted to highlight disparities in education, literacy, and hygiene access across Indian states. My goal was to create a tool that helps policymakers, educators, and researchers quickly spot gaps and make data-driven decisions, supporting Sustainable Development Goals (SDGs) 3, 4, 5, and 6.
What it does
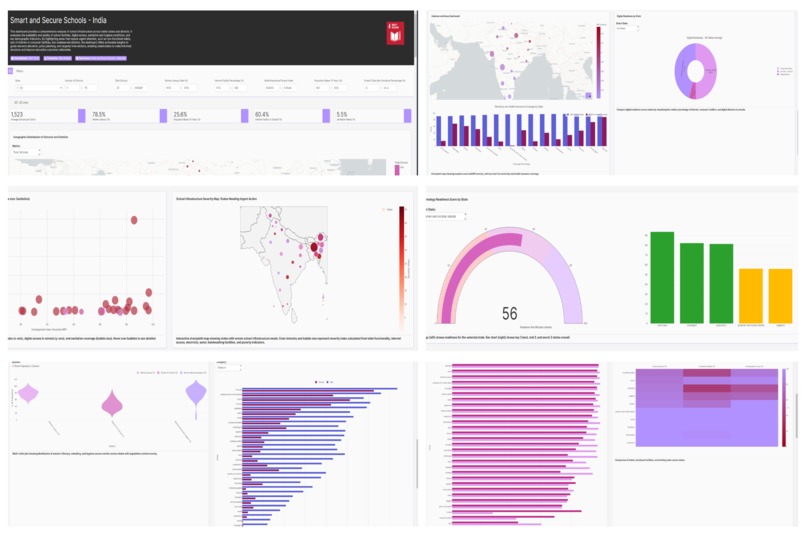
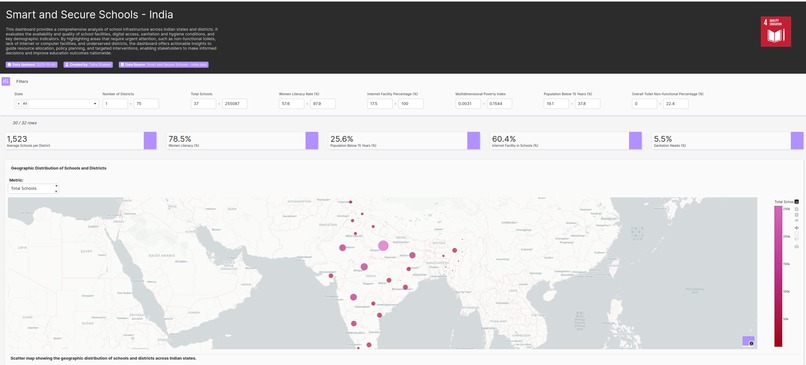
The dashboard provides state-wise insights on key metrics aligned with SDGs:
- Youth population (
pop_below15_per) – SDG 4 - Literacy & schooling (
women_literate_per,women_10plus_school_per) – SDG 4, 5 - Menstrual hygiene (
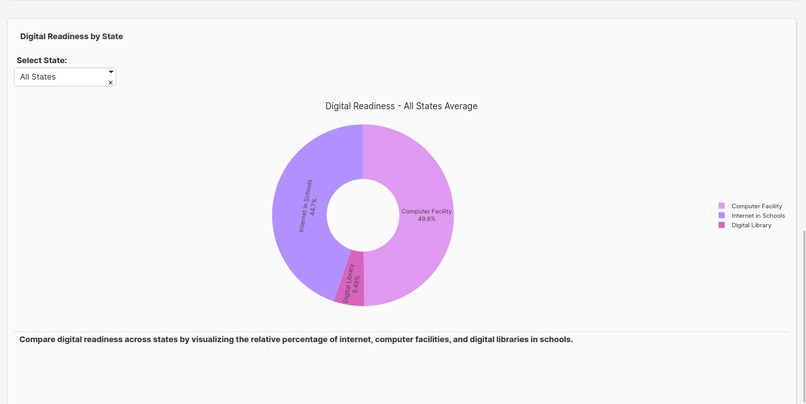
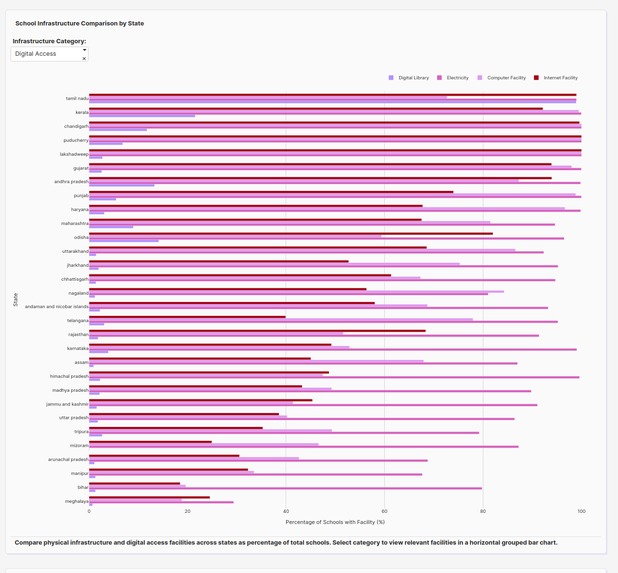
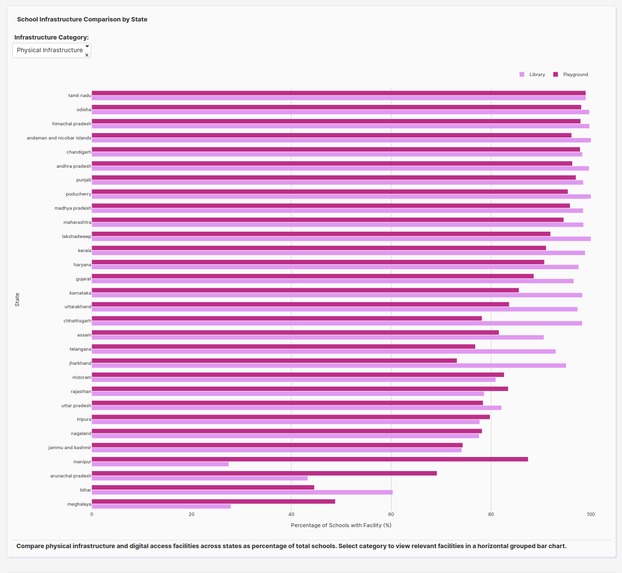
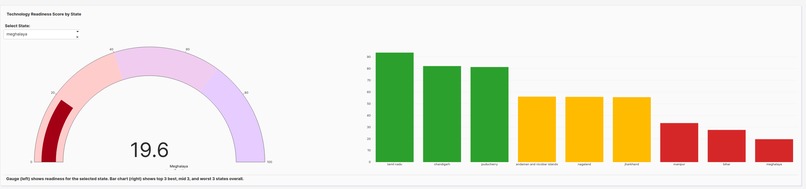
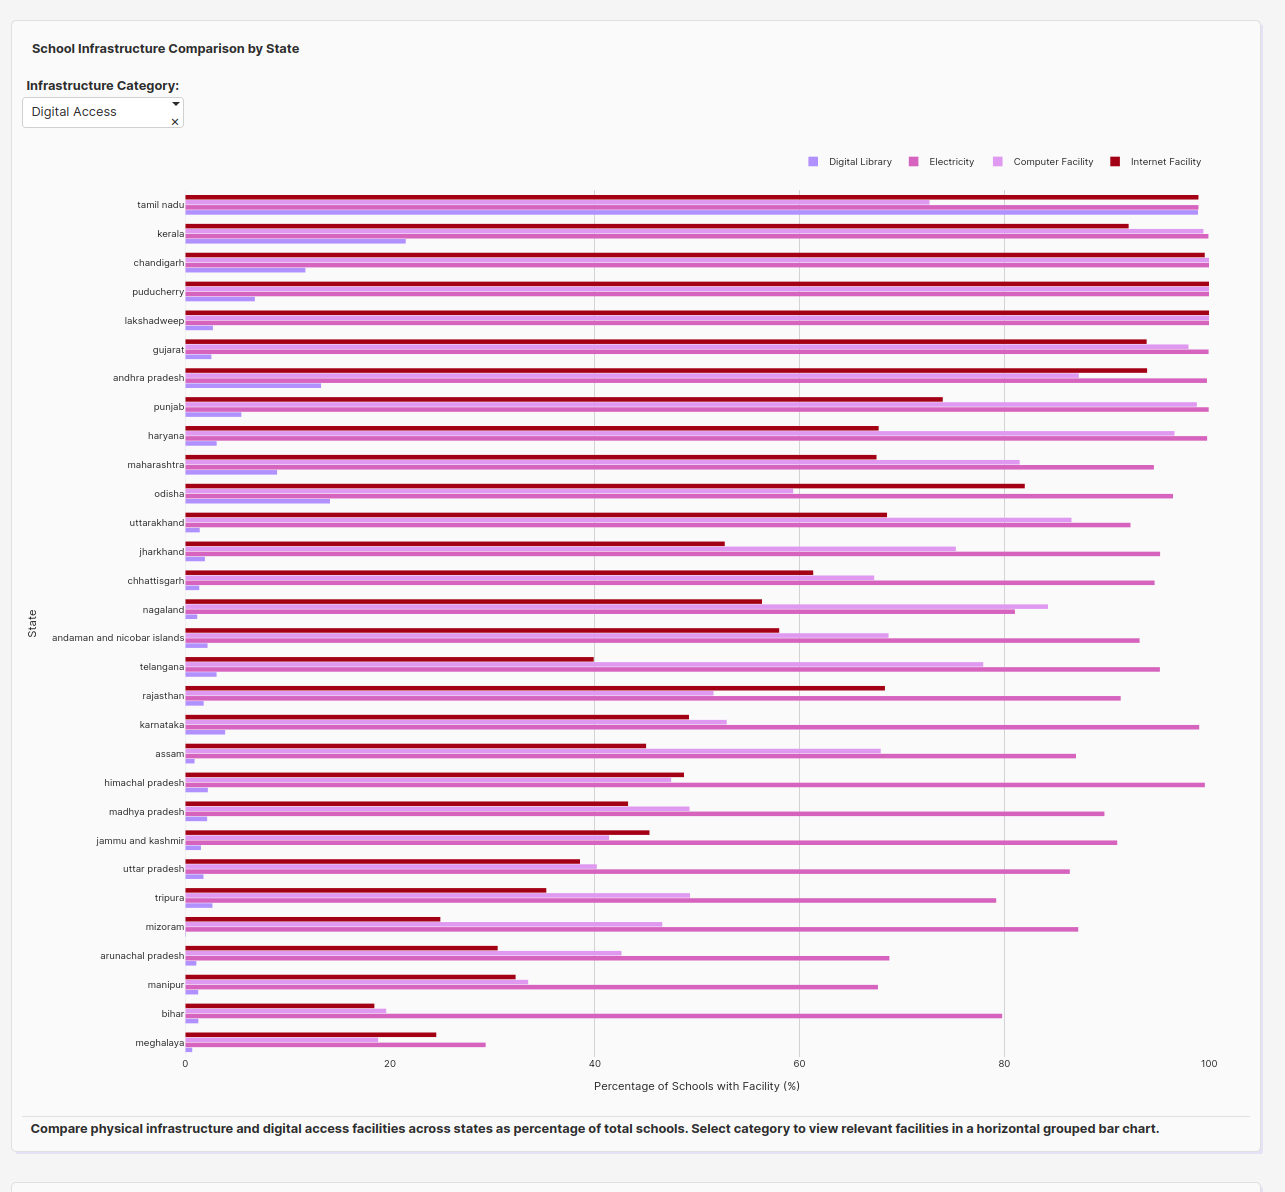
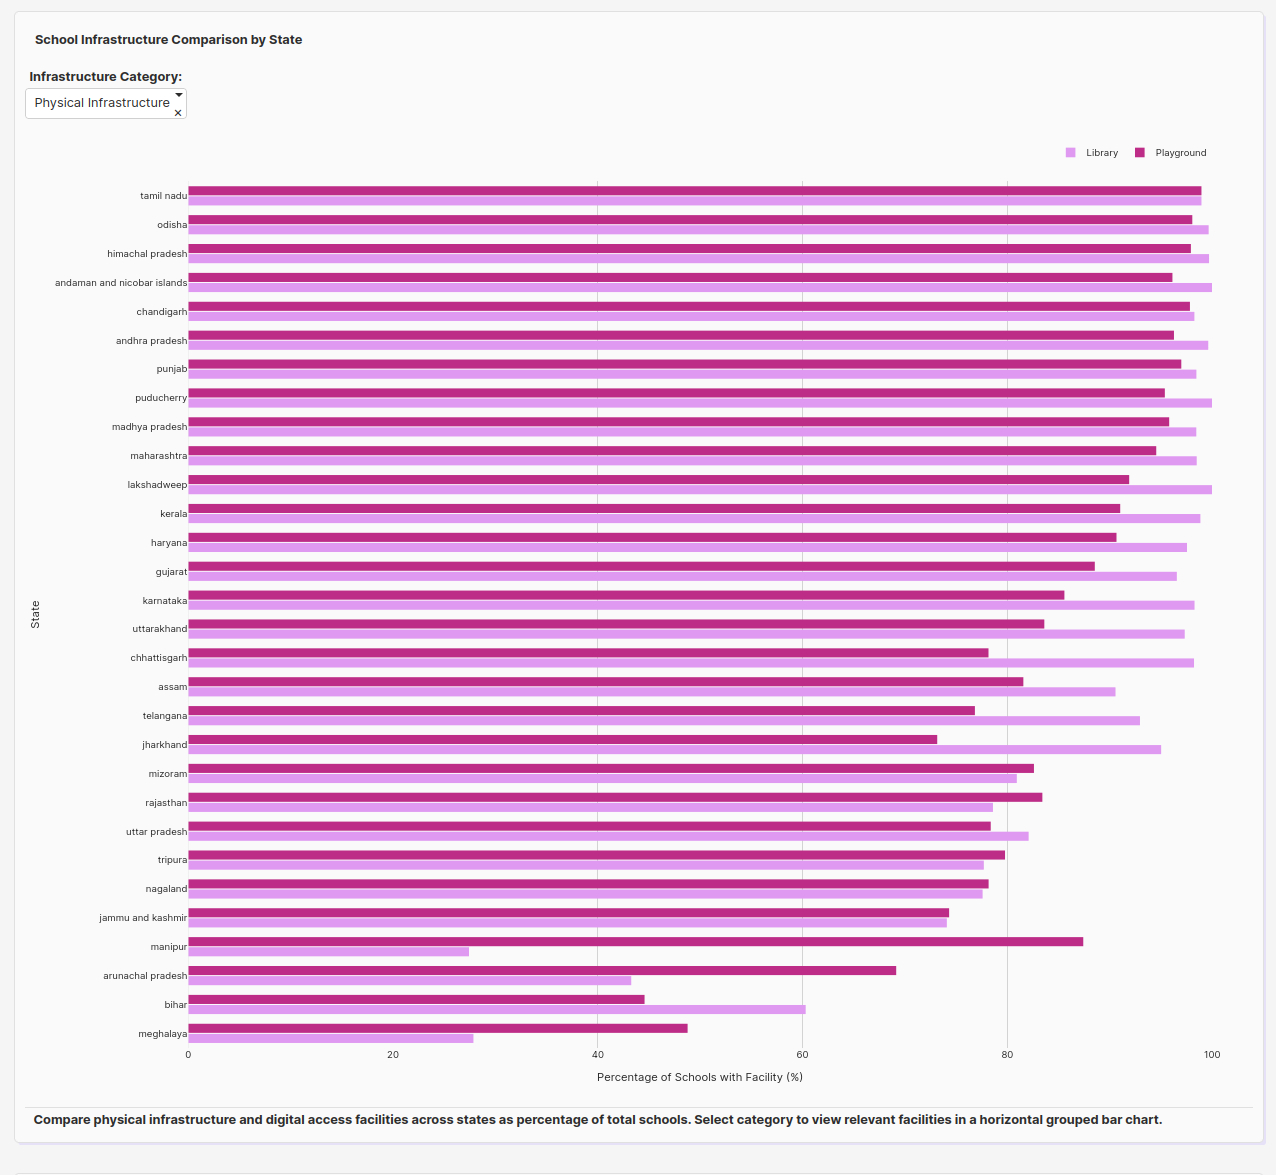
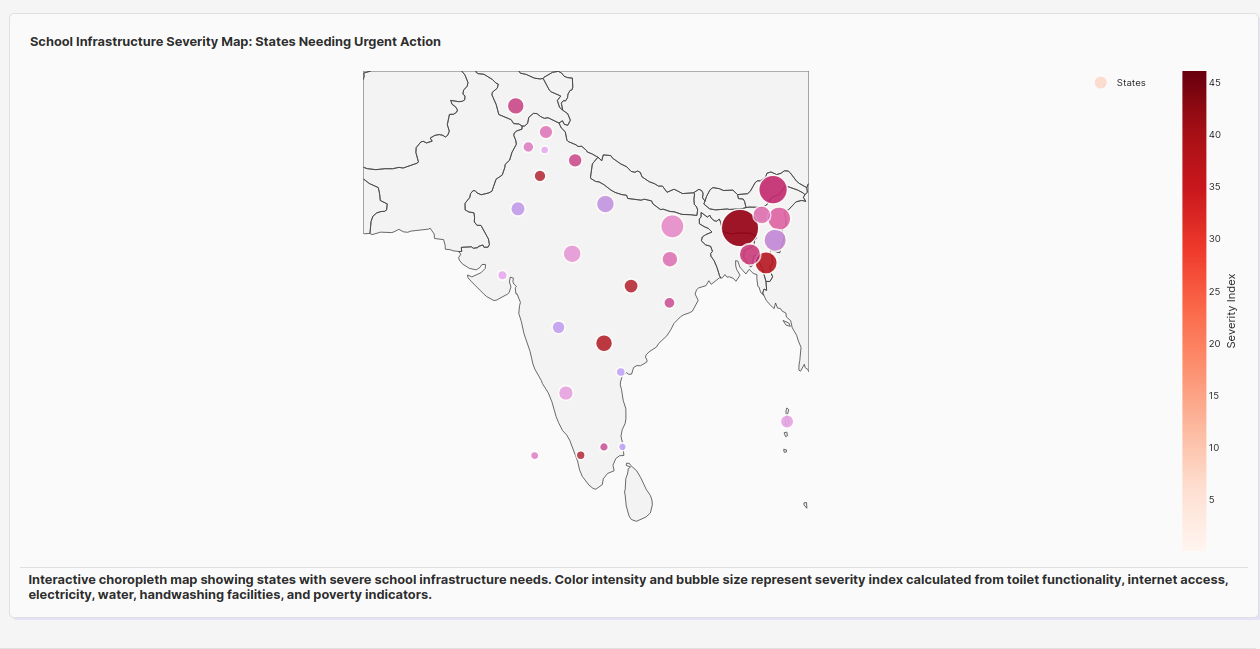
women_menstrual_hygiene_per) – SDG 3, 5 - School infrastructure (electricity, libraries, playgrounds, computer facilities, internet, drinking water) – SDG 4, 6
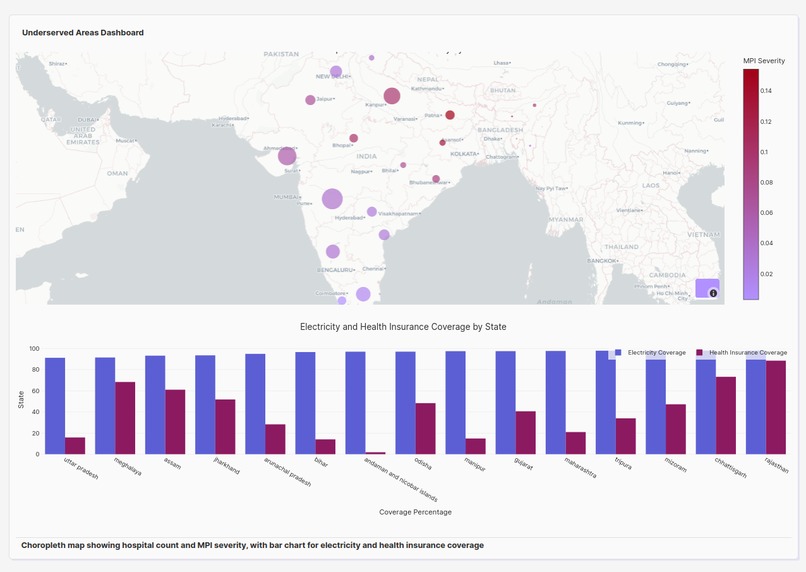
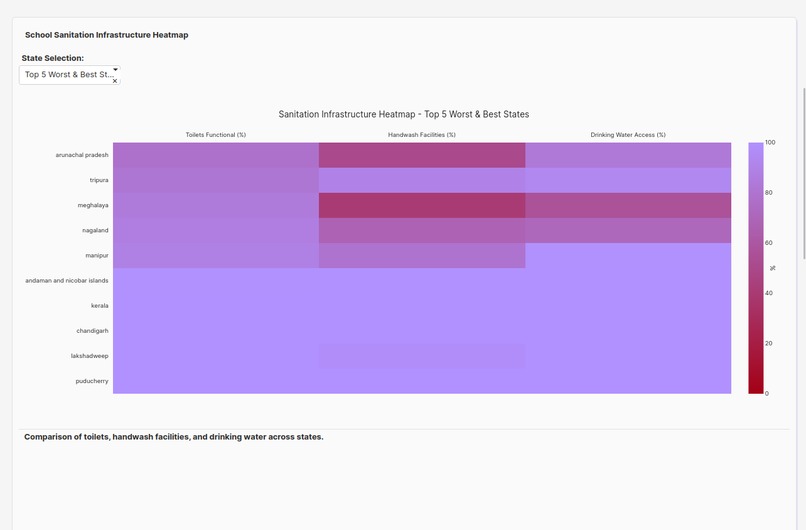
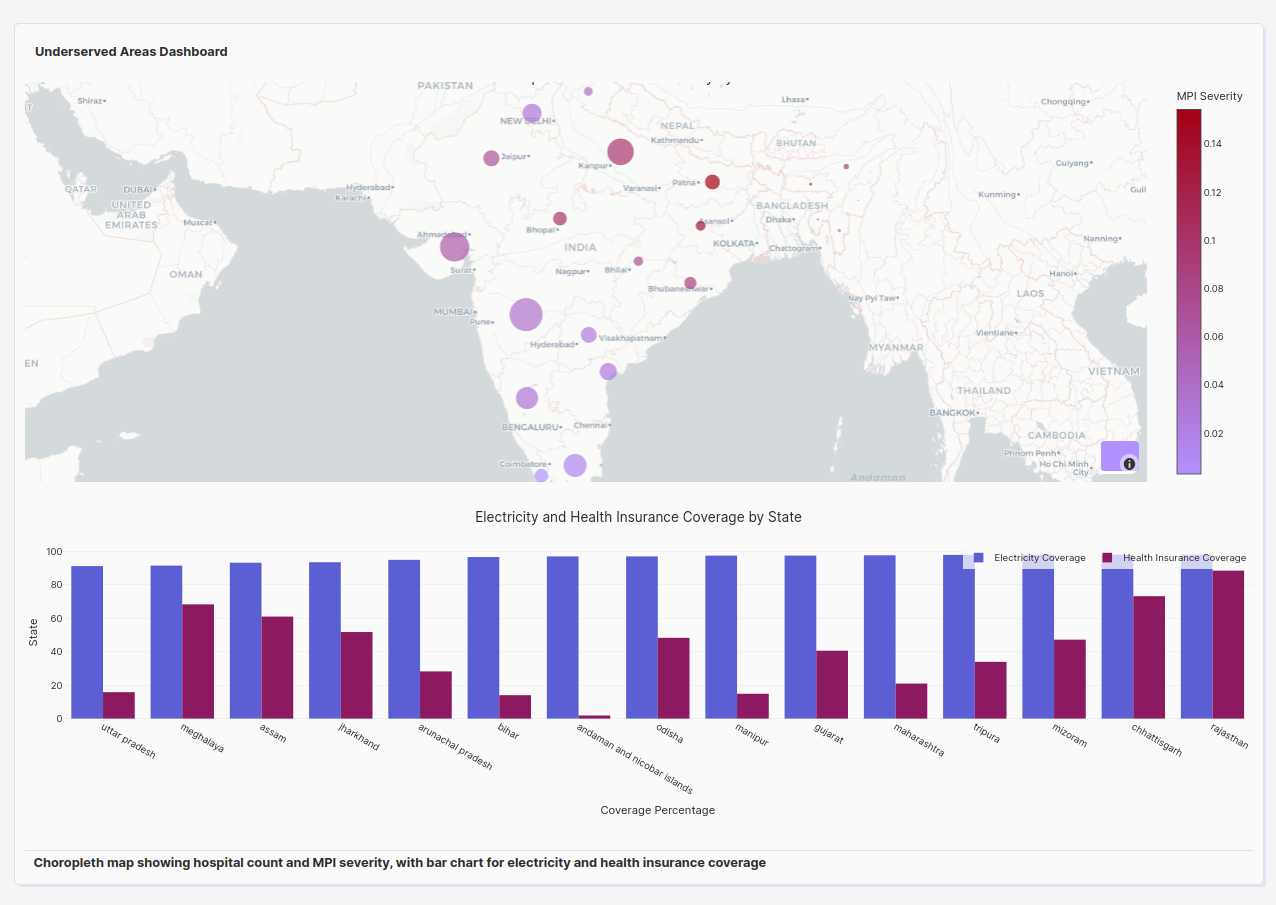
- Sanitation (functional and non-functional toilets, handwash facilities) – SDG 6
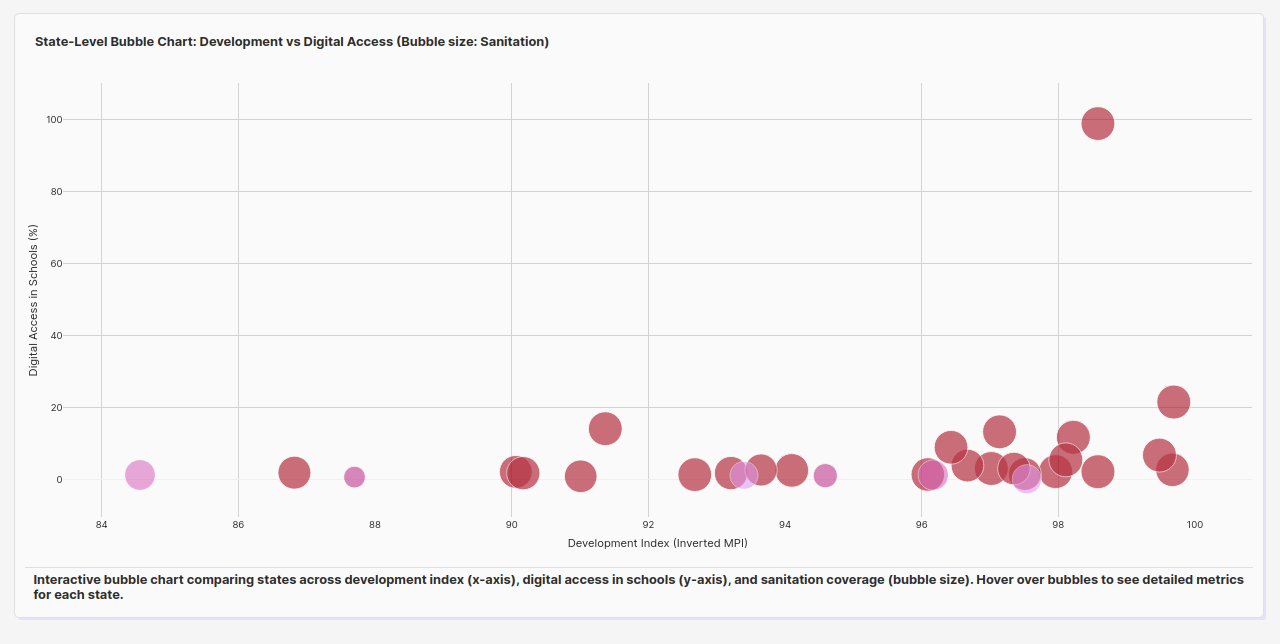
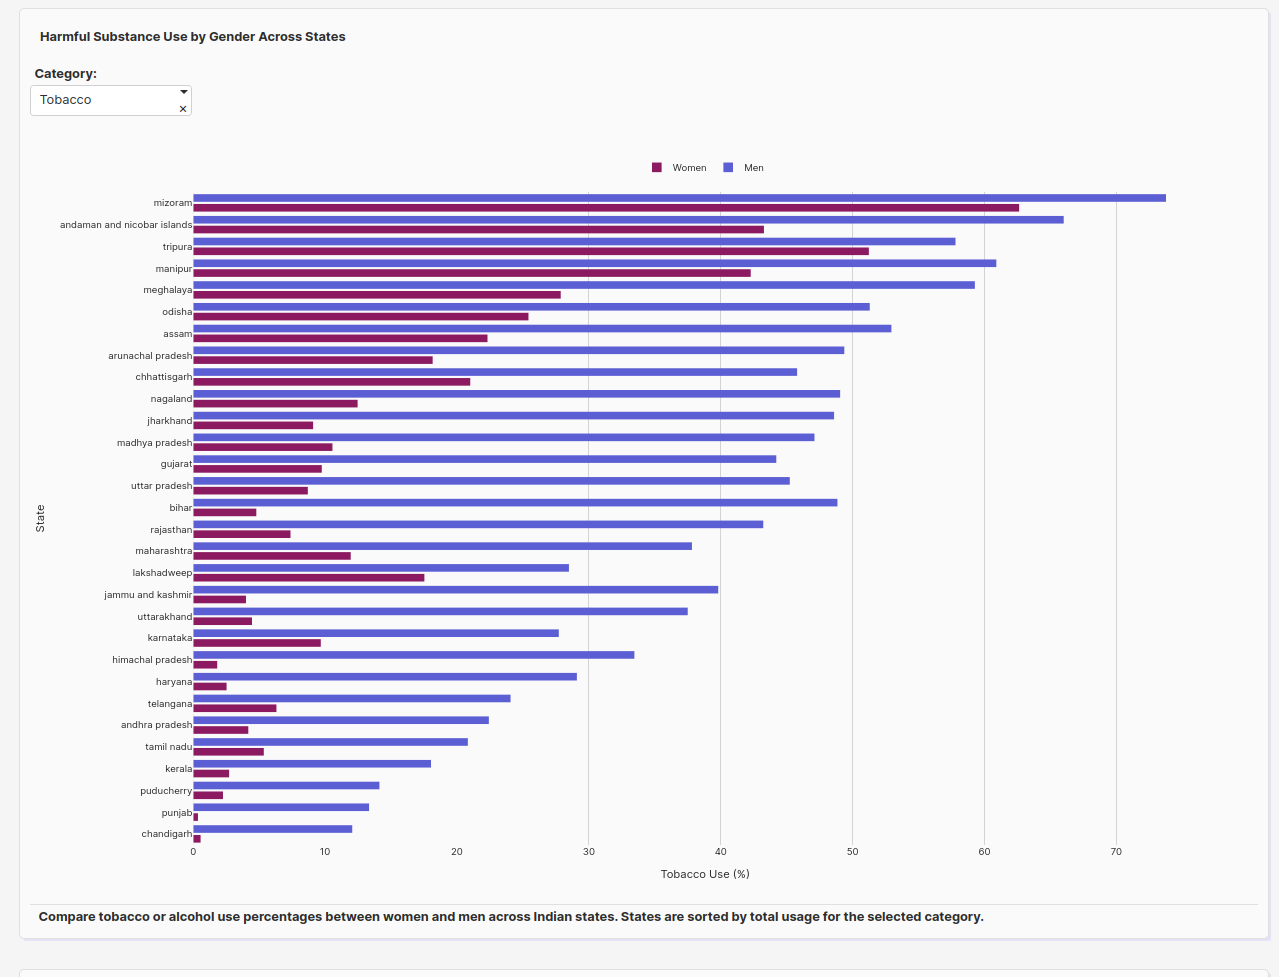
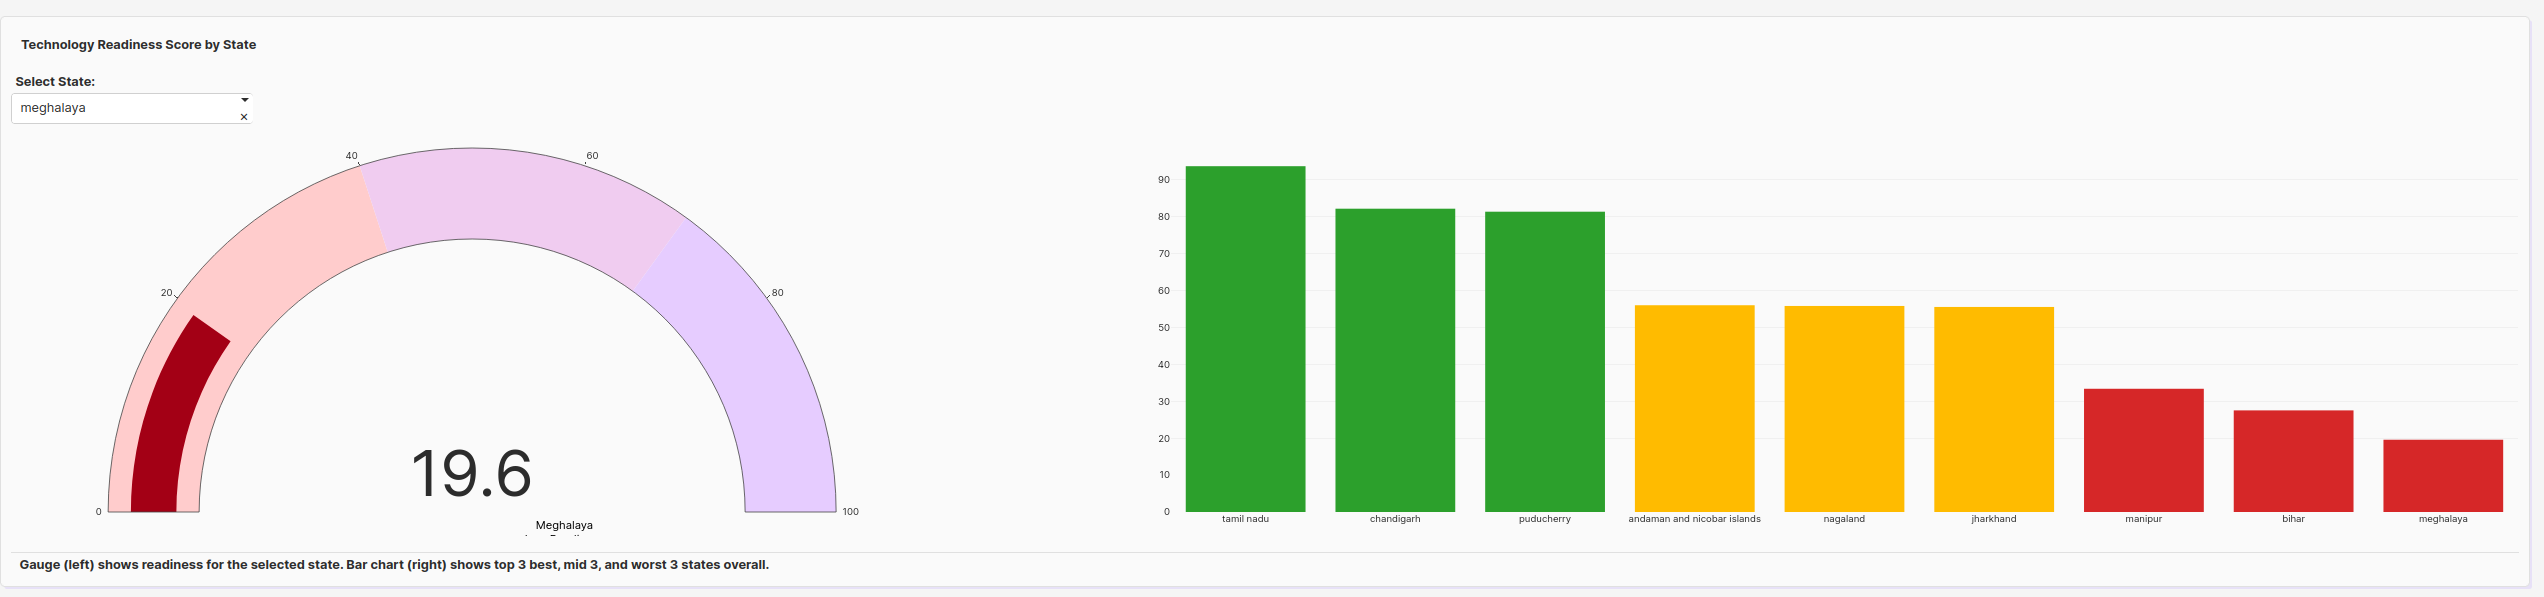
Users can interactively compare states, filter metrics, and explore both physical and digital school facilities using bar charts, grouped bars, and hollow pie charts.
How I built it
- Aggregated and normalized data from multiple sources
- Created interactive visualizations with Plotly
- Built the dashboard using Dash and Dash Design Kit
- Implemented dynamic features like dropdown filters, sorting, and responsive chart height
Challenges I ran into
- Inconsistent and missing data across states
- Avoiding clutter while visualizing multiple metrics
- Ensuring charts scale properly for all states/UTs
Accomplishments that I'm proud of
- Developed a comprehensive interactive tool for decision-makers
- Visualizations make it easy to spot gaps in education, hygiene, and infrastructure
- Combined physical and digital school facilities in a single, user-friendly view
What I learned
- Techniques for data cleaning, aggregation, and normalization
- Effective visual storytelling for multiple metrics
- Building interactive dashboards with dropdowns, sorting, and hover info
- Using color palettes and chart layout to highlight differences clearly
What's next for Smart and Secure Schools - India
- Add trend analysis over time for districts and states
- Include additional health and education metrics as data becomes available
- Enable policy simulations and scenario analysis for targeted interventions
Built With
- plotly
- plotly-studio
- plotlystudio


Log in or sign up for Devpost to join the conversation.