Devpost
Participate in our public hackathons
Devpost for Teams
Access your company's private hackathons
Grow your developer ecosystem and promote your platform
Drive innovation, collaboration, and retention within your organization
By use case
Blog
Insights into hackathon planning and participation
Customer stories
Inspiration from peers and other industry leaders
Planning guides
Best practices for planning online and in-person hackathons
Webinars & events
Upcoming events and on-demand recordings
Help desk
Common questions and support documentation
Sort by:
Comprehensive analysis of well-being indicators across OECD countries, examining various measures of quality of life including health, safety, education, and social connections.
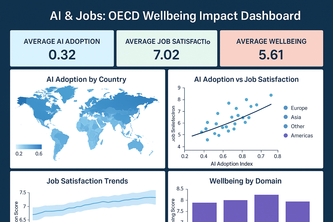
Interactive dashboard analyzing AI’s impact on jobs, income, work-life balance, and wellbeing across OECD countries using AI-driven insights.
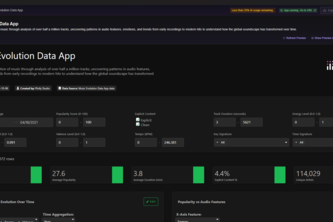
Visualizing a century of music — where data meets rhythm and history sings.
Global Unicorn Companies Insights is an interactive app revealing unicorn distribution, sector performance, and funding trends, enabling fast, data-driven decisions.
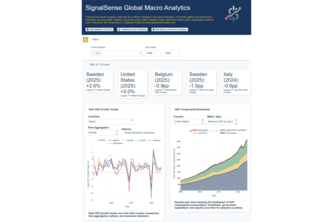
Professional analytics app for economists and asset managers to monitor long-term global macroeconomic indicators across growth, inflation, monetary policy, labor markets, trade, and fiscal metrics.
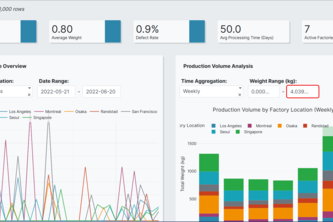
Sentinel is a predictive maintenance platform that analyzes real-time sensor data from factory machinery.
Explore how the world lives and feels — one interactive bubble at a time. 🌍✨
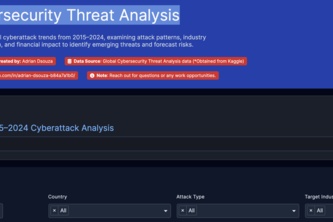
Comprehensive analysis of global cyberattacks, examining attack patterns, industry targeting, geographic distribution, and financial impact to identify emerging threats and forecast risks.
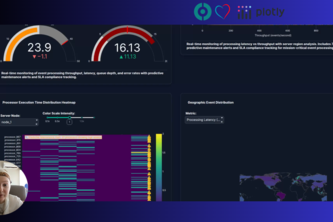
Unlocking near real-time event processing analytics full potential with Plotly Studio
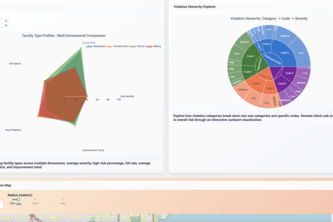
CleanCity Insights turns Chicago’s food inspection data into an interactive story of health and safety. Explore where your neighborhood stands — from spotless kitchens to areas that need attention.
Explore global happiness with natural language — charts, correlations, and policy suggestions powered by Plotly Studio AI.
Unlocking the Future: Track AI Adoption Trends Across Industries and Regions!
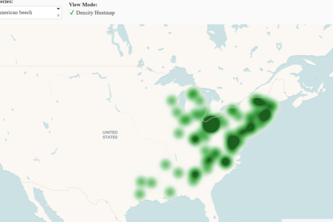
Discover the plants that shape where you live: learn, explore, and connect with local biodiversity with this plant explorer dashboard.
Roads to Reports: Understanding Mobility in Telangana
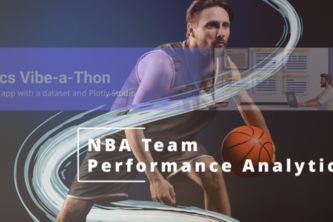
NBA Team Performance Analytics is an interactive data exploration project, designed to help users visualize and understand team performance across seasons for fan, coach, or analyst.
Your AI lens for spotting manipulative language.
Harnessing AI to uncover the hidden dynamics of molecular interactions. Visualization of compound molecule and protein interactions into interpretable insight.
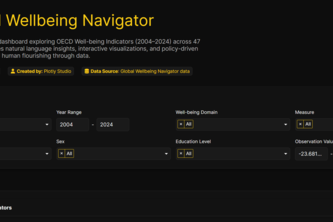
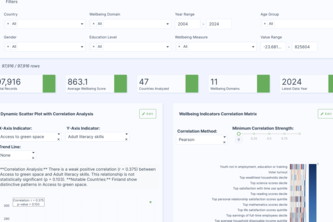
Global Wellbeing Explorer is an AI-powered comprehensive dashboard that transforms the OECD Better Life Index dataset into actionable insights for policymakers, researchers, and citizens.
A data app that visualises the history of global volcanic eruptions, including geographic hotspots, eruption power and scale, historical trends, and the most powerful volcanoes in recorded history.
Discover surprising correlations between education, health, safety, income and life satisfaction indicators through dynamic visualizations and country-level insights.
Transforming OECD wellbeing data into evidence-based policy decisions Now, Policy decisions made smarter with interactive wellbeing analytics
An interactive analytics dashboard that visualizes disease prevalence trends across countries, enabling users to explore, filter, and compare health metrics dynamically.
Discover how green spaces and clean air boost life satisfaction across countries through interactive visualizations of environmental quality and well-being.
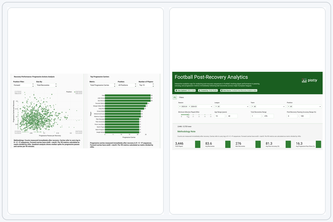
One app that turns Europe’s top-league event data into instant insights on player & team performance right after winning possession.