-
-
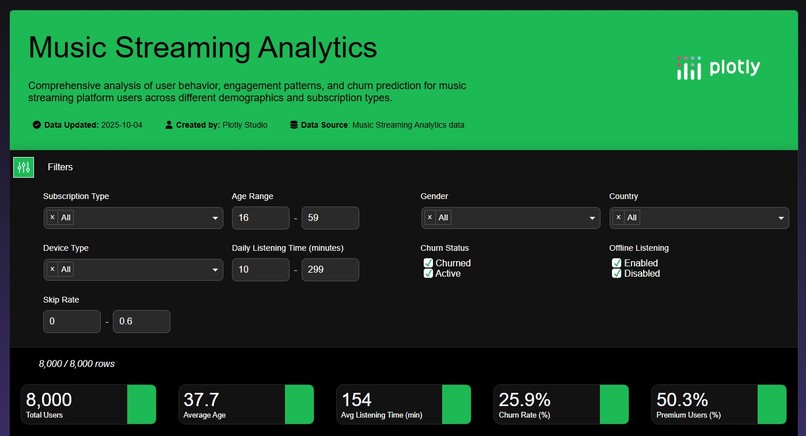
App Summary 1
-
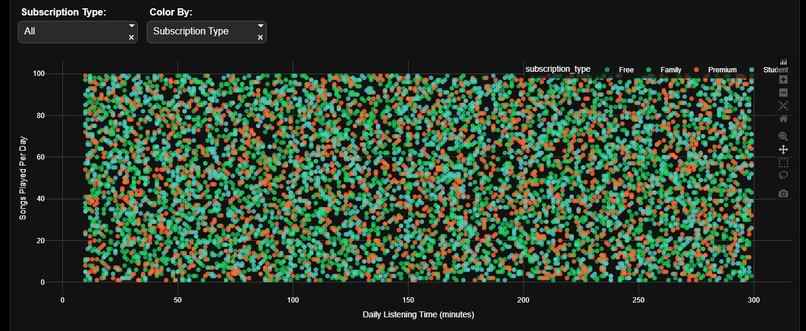
Listening Behavior Analysis
-
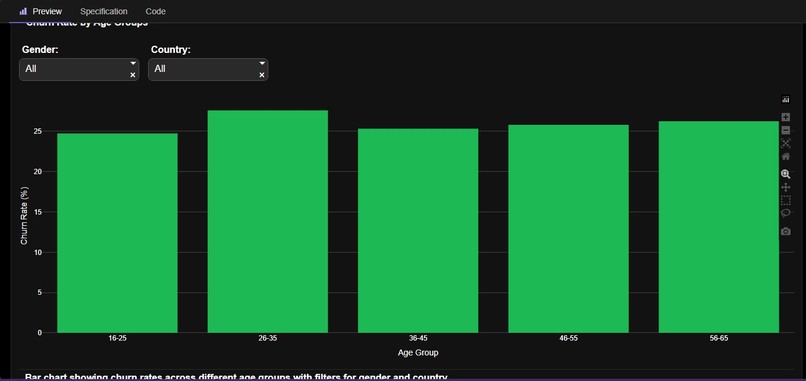
Churn rate by age group and gender
-
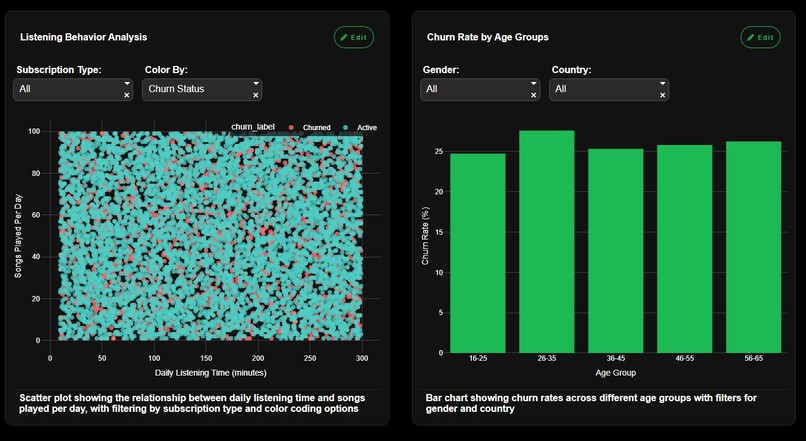
App summary 2
-
App summary 3


Inspiration
As an avid music listener on Spotify's free tier, the recent surge in ad frequency became impossible to ignore. This annoyance sparked a critical question: How many users are abandoning this music giant, and who are they? This inspired me to create a robust visualization dashboard to measure if and how this aggressive ad strategy is driving significant customer churn and negatively impacting user behavior.
What it does
The visualization and charts gives the following:
Listening Behavior Analysis: Deep dive into how user activity (session length, time of day) changes pre and post- ad surge.
Churn Demographics: Identifies the age groups, locations, or free-tier versus premium segments most likely to quit or downgrade.
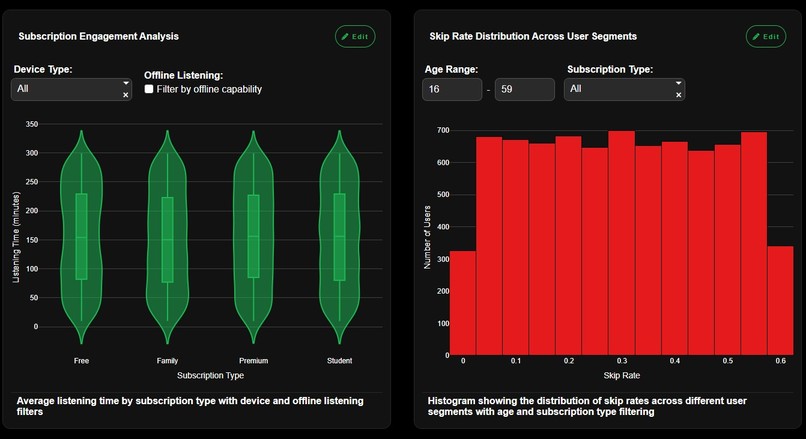
Subscription Engagement: Visualizes the conversion funnel and identifies drop-off points between free, trial, and paid tiers.
Skip Rate Patterns: Analyzes if specific ad types or high ad frequency directly correlate with spikes in track slipping.
Ads Impact Analysis: Quantifies the average session revenue vs. the lifetime value lost due to ad-induced churn.
Geographic Usage Trends: Maps regional differences in ad tolerance and identifies high-risk geographic markets for churn.
How we built it
We rapidly prototyped and deployed the core visualization using Plotly Studio. This platform allowed us to quickly connect to the pre-processed Spotify dataset from Kaggle and leverage Plotly's powerful charting capabilities to create a highly interactive, web-ready dashboard focused on time-series analysis and geographical mapping.
Challenges we ran into
The primary challenge was data inferencing. Since the public Kaggle dataset does not contain explicit "ad frequency" or "churn reason" fields, we had to define a proxy for churn. Our solution involved engineering a synthetic metric that tracks the decline in listening activity over time for specific user cohorts to serve as a reliable indicator of ad-induced abandonment.
Accomplishments that we're proud of
Our proudest accomplishment is creating a dashboard that moves beyond simple vanity metrics to deliver actionable business intelligence. Specifically, we:
Quantified the Churn Risk: We successfully used a time-series model to identify and visualize the exact cohorts (e.g., users aged 18–24 using mobile devices) that pose the highest churn risk due to high ad frequency.
Created a Single-Source Truth: Consolidated six distinct, but related, analyses into a single, cohesive dashboard, enabling stakeholders to grasp the full lifecycle of ad impact from behavior change to lost revenue.
What we learned
We gained deep insights into the complexity of modeling human behavior using only feature engineering. The project reinforced the value of:
Proxy Metric Development: Understanding that key business drivers (like ads) often require creating clever proxy metrics when direct data (like "ad counter") is unavailable.
Impact of Interactivity: Learning how essential Plotly's interactive features are for allowing a user to explore data and confirm a hypothesis—like filtering down to a specific region to confirm a suspected churn trend.
What's next for Music Streaming Analytics
The current dashboard is just the foundation. Next steps for this project include:
Predictive Modeling: Integrating the current insights into a machine learning model to predict future churn rates based on planned ad schedule increases.
A/B Testing Simulation: Adding a feature that allows a user to simulate the impact of reducing ads for a high-risk demographic and visualize the potential revenue lift from saved subscriptions.
Cross-Platform Analysis: Incorporating data from other streaming platforms (e.g., Apple Music) to benchmark Spotify's ad tolerance against its competitors.


Log in or sign up for Devpost to join the conversation.