-
-
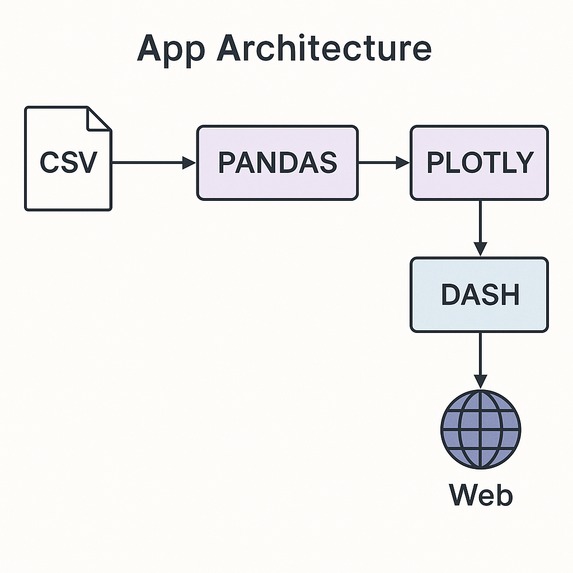
From Data to Living Visualization: Data flows from CSV → Pandas → Plotly → Dash → Web — the base of The Living Trust Graph.
-
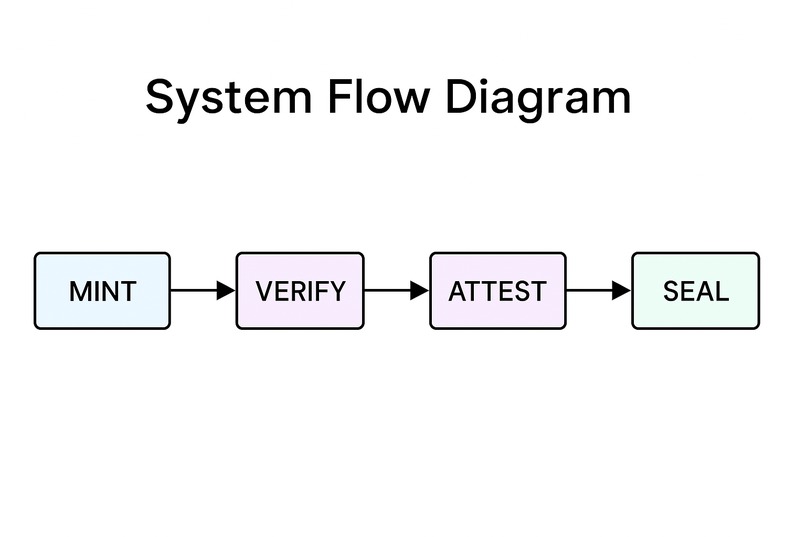
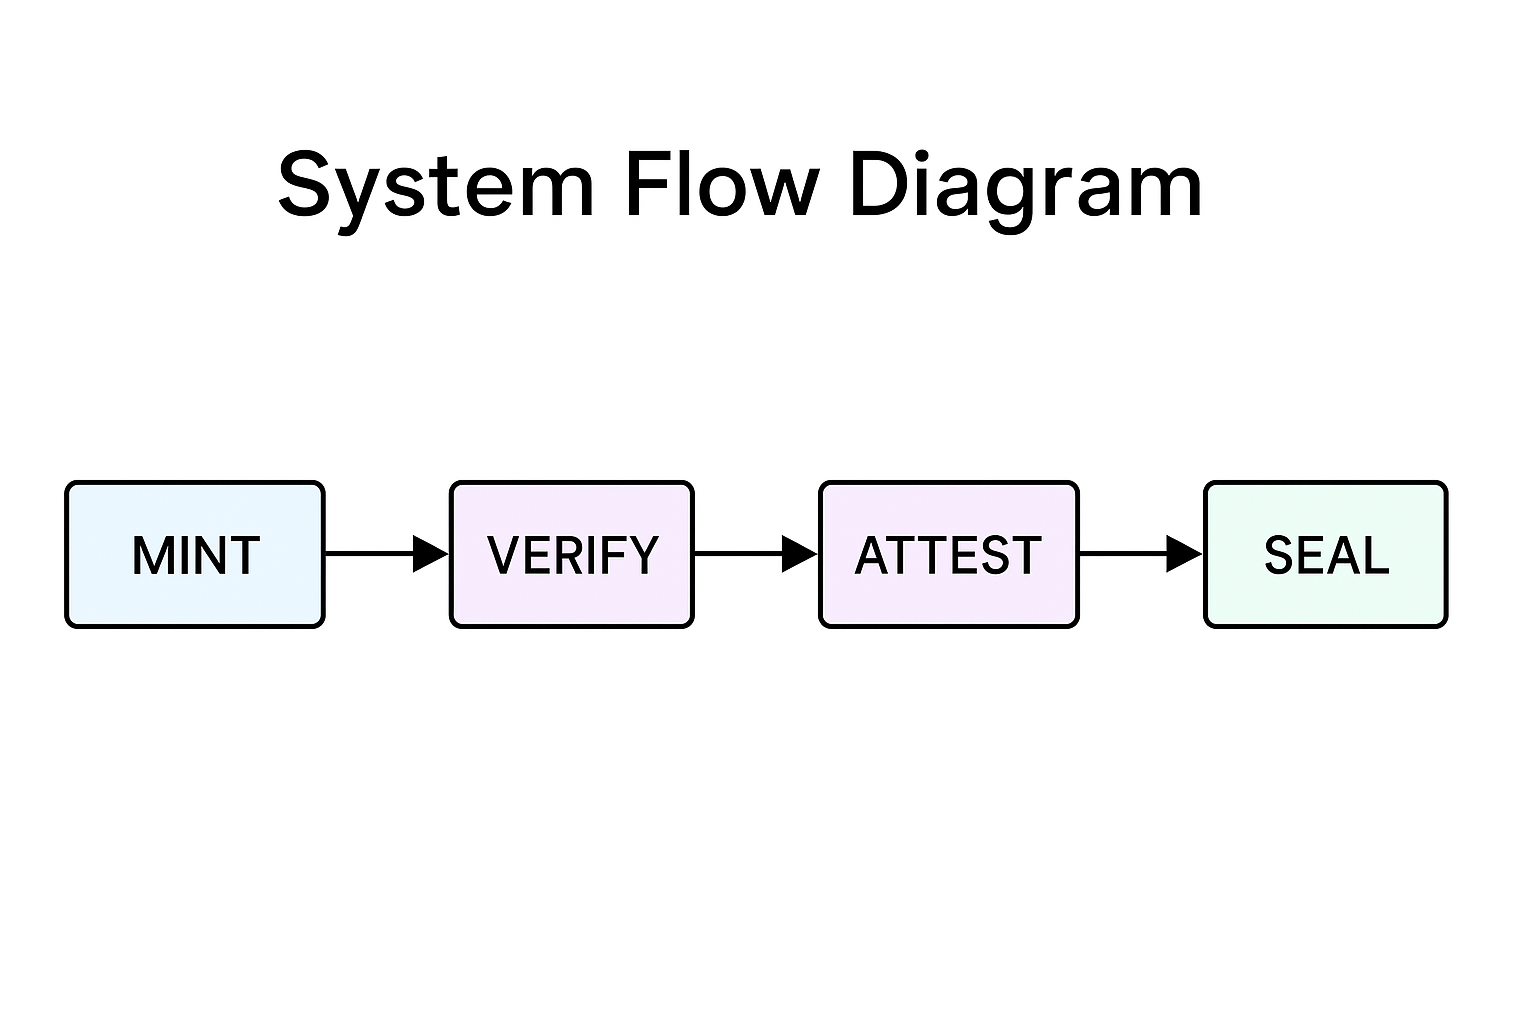
Heartbeat of Verification: Illustrates the sequential trust cycle: Mint → Verify → Attest → Seal, visualized as the living rhythm of trust.
-

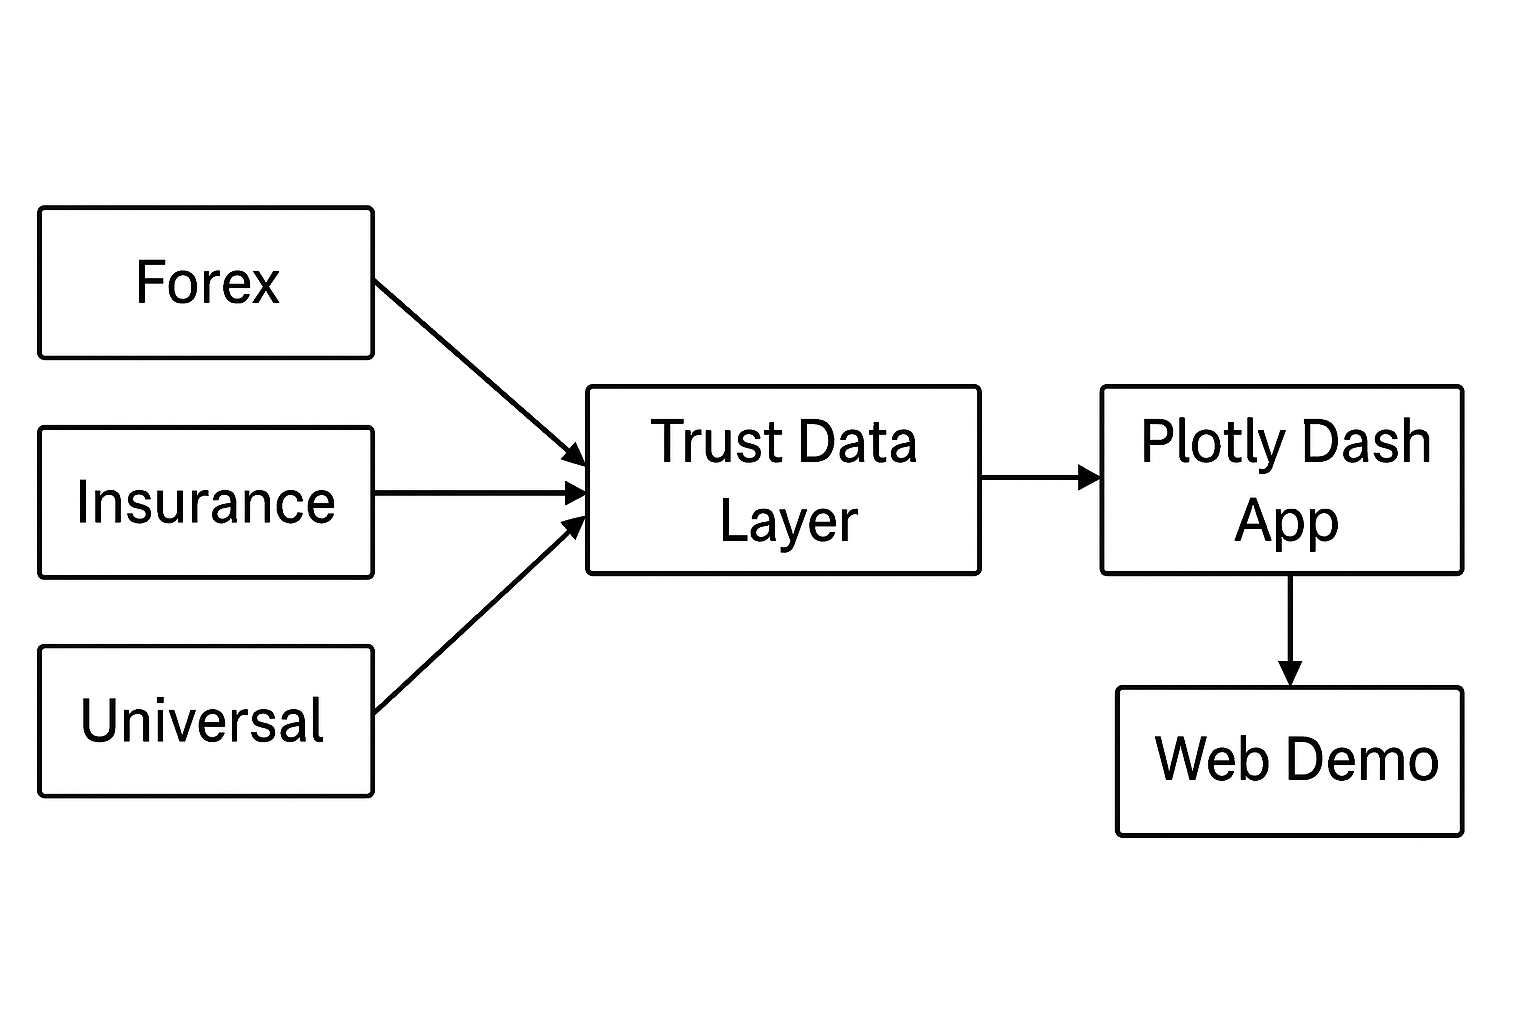
Corridors Converging into the Living Graph: Forex, Insurance, and Universal corridors unite into one central Trust Data Layer.

Inspiration
In a world full of credentials, proofs, and digital claims, trust itself is invisible. The Living Trust Graph was born from the idea that trust can be seen, felt, and measured — like a living pulse in data form. We wanted to turn the invisible heartbeat of verification—Mint → Verify → Attest → Seal—into an interactive data experience, where each action forms part of a living ecosystem of integrity.
What it does
The Living Trust Graph visualizes how verifiable identity evolves through events of trust. Each “mint,” “verify,” or “attest” event becomes a dynamic node in a real-time Plotly dashboard, creating an animated timeline of digital trust. It transforms abstract proofs into an intuitive story of how trust grows, stabilizes, and multiplies across corridors such as Forex, Insurance, and Universal Identity.
How we built it
Python + Plotly Dash form the visual and logic core. Pandas manages event data, while Dash callbacks animate interactions. The prototype runs locally or can be deployed with one-click via Docker or Render.com. Event data (Mint → Verify → Attest → Seal) is stored as a simple CSV and rendered into multiple visual layers — bar charts, timelines, and network graphs — all updating live.
Challenges we ran into
Designing a data model that’s simple yet expressive enough to represent trust flows. Creating visuals that carry emotional resonance while staying technically lightweight. Keeping the app fully self-contained — no backend APIs or databases, only pure Python logic and open-source libraries.
Accomplishments that we're proud of
We turned a philosophical idea — trust as a living phenomenon — into a functional, visual data product. Achieved a working Dash app deployable within minutes. Designed a reusable structure for future identity dashboards and “living proofs.”
What we learned
That data visualization can be poetic — numbers can speak of relationships, not just quantities. How to translate a blockchain-style verification logic into an accessible data-storytelling experience. That small, modular Dash apps can scale quickly into production with minimal overhead.
What's next for The Living Trust Graph
Integrate live event feeds from the TrustSeal / ForexTrust ID ecosystem. Add QR-based verification so users can scan and view Seal details instantly. Extend to multi-authority attestation, turning this app into the visual interface of a global “Trust Network.”


Log in or sign up for Devpost to join the conversation.