-
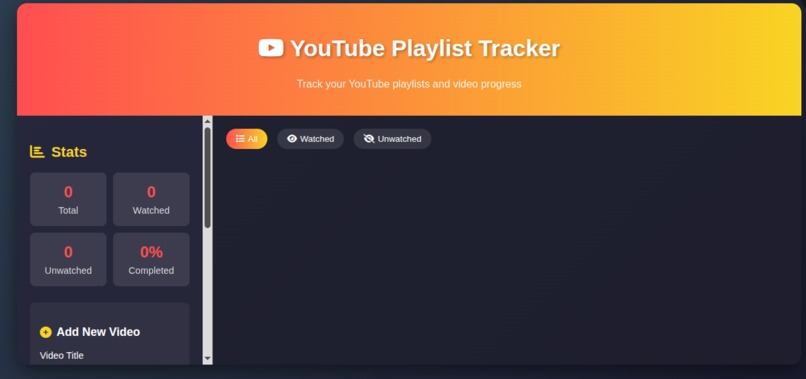
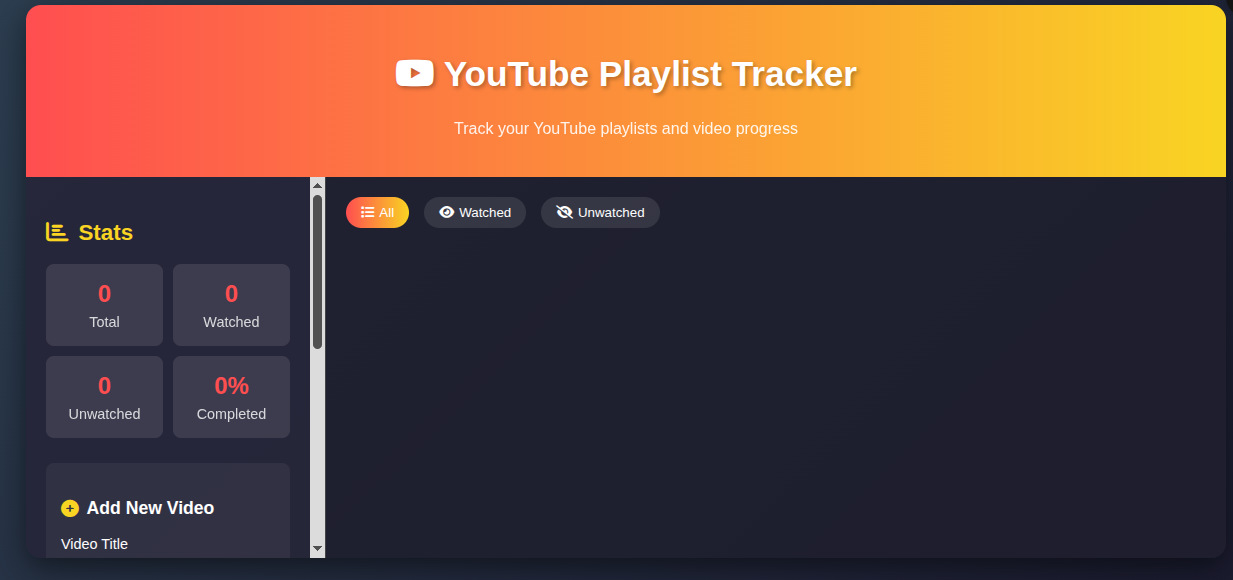
Tracker Look
Inspiration
Content creators often struggle to understand their channel growth across videos. Many existing tools are either too complicated, expensive, or lack the flexibility creators need. We wanted to build something simple, visual, and accessible to help creators gain insights into their performance.
What it does
YouTube Growth Analyzer provides an easy, interactive dashboard to track and visualize YouTube channel metrics. With dynamic Plotly charts, users can explore subscriber growth, video views, engagement rates, and overall trends—all in one place. The tool makes data exploration intuitive, so creators can make better content decisions.
How we built it
We combined JavaScript, HTML5, and CSS3 for the interface design, ensuring a clean and user-friendly layout. Plotly was used for interactive visualizations, and the YouTube API was integrated to fetch real-time channel data. Together, these tools create a responsive, engaging analytics dashboard that anyone can use with minimal setup.
Accomplishments we’re proud of
- Delivering a fully functional analytics tool that is both beginner-friendly and powerful.
- Designing clear dashboards that make data easy to understand.
- Overcoming API rate limit challenges and ensuring smooth performance.
What we learned
Throughout this project, we learned how to work with the YouTube API, handle real-time data, and design dashboards that balance clarity with interactivity. We also gained experience in integrating front-end design with analytics libraries like Plotly.
What’s next for YouTube Growth Analyzer
- Expanding to include multiple social media platforms.
- Adding report export options for creators.
- Introducing simple predictive analytics to estimate future growth trends.
- Enhancing the project into a full standalone application.


Log in or sign up for Devpost to join the conversation.