Devpost
Participate in our public hackathons
Devpost for Teams
Access your company's private hackathons
Grow your developer ecosystem and promote your platform
Drive innovation, collaboration, and retention within your organization
By use case
Blog
Insights into hackathon planning and participation
Customer stories
Inspiration from peers and other industry leaders
Planning guides
Best practices for planning online and in-person hackathons
Webinars & events
Upcoming events and on-demand recordings
Help desk
Common questions and support documentation
Sort by:
Rocket space is scarce. Our simulation uses AI-powered auctions to pick which satellites fly, balancing profit and fairness to build a healthier, more accessible space economy for everyone.
A data-driven look at Star Wars fandom, analyzing favorite characters, movies, and worlds to reveal meaningful patterns and connections in fan preferences.
Multi-Agent Diagnosis with Web3 Security & Encryption
A webpage or an app that tracks your addiction habit and recommends you what changes you need to do in your daily life and how it will impact your academics.
An interactive simulation quantifying the multi-trillion dollar economic and humanistic cost of Kessler Syndrome, the catastrophic end of space access.
Project Goldilocks is an interactive toolkit that analyzes NASA exoplanet data, scoring habitability, visualizing systems, and generating AI-powered stories of worlds too hot, too cold, or just right.
Upload your data → Ask questions → Get instant answers & charts.
Earth’s life-support is under strain. We rank exoplanets 0–1 for human-centric habitability using NASA data (insolation, temp, radius, mass, orbit) to pinpoint candidates for future human relocation.
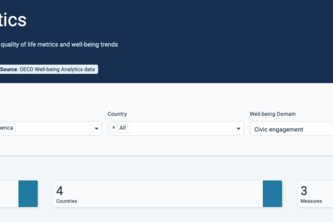
Interactive exploration of OECD Better Life Index indicators to analyze quality of life metrics and well-being trends globally.
Explore the World, Staying Healthy
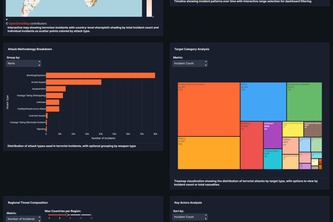
Explore decades of global conflict. An interactive dashboard transforming complex terrorism data into clear, actionable insights on patterns, hotspots, and trends.
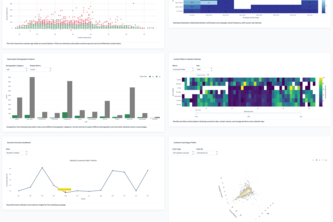
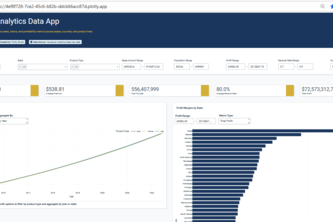
End-to-end analysis of superstore performance
From tokens to transformers: master NLP hands-on
Your shiok one-stop app to explore Singapore’s HDB living environments with interactive data insights
Explore wellbeing across the globe with interactive data insights.
Unlock the psychology of banking. This interactive story goes beyond demographics to decode the hidden drivers of customer financial decisions, revealing what truly motivates a 'yes' to a campaign.
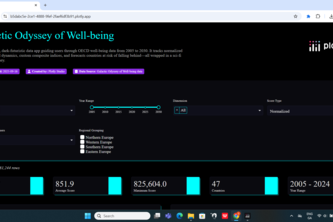
Navigate the cosmos of global well-being—from 2005’s baseline insights to 2030’s forecasts. Charting humanity’s well-being across time and space.
Create synthetic data and demonstrate the power of Plotly Studio
Explore 20+ years of data, forecast trends, simulate policies, and uncover equity gaps to drive data-informed decisions for a healthier, fairer world.
WellBeing360 is an interactive Plotly Studio dashboard that provides a 360-degree analytical view of global well-being indicators.
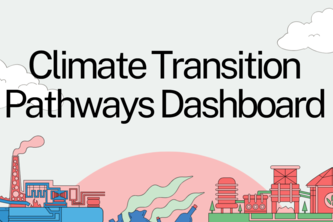
How do climate & different economies evolve under different scenarios & changing policies?
This project is an advanced AI Data Intelligence Dashboard that leverages multiple AI agents to provide comprehensive data analysis, machine learning, and business intelligence capabilities
“By accurately detecting urban expansion in Manila, this model can guide real estate investment, inform financial forecasting, and support sustainable city planning for social and economic good.”
An interactive guide that turns hidden tariff data into clear insights for industries, economies, and households — making global policy personal and real with macrosocioeconomic insights.”