-
-
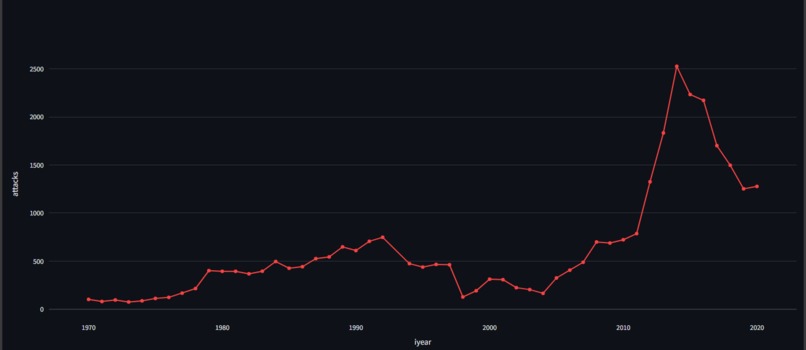
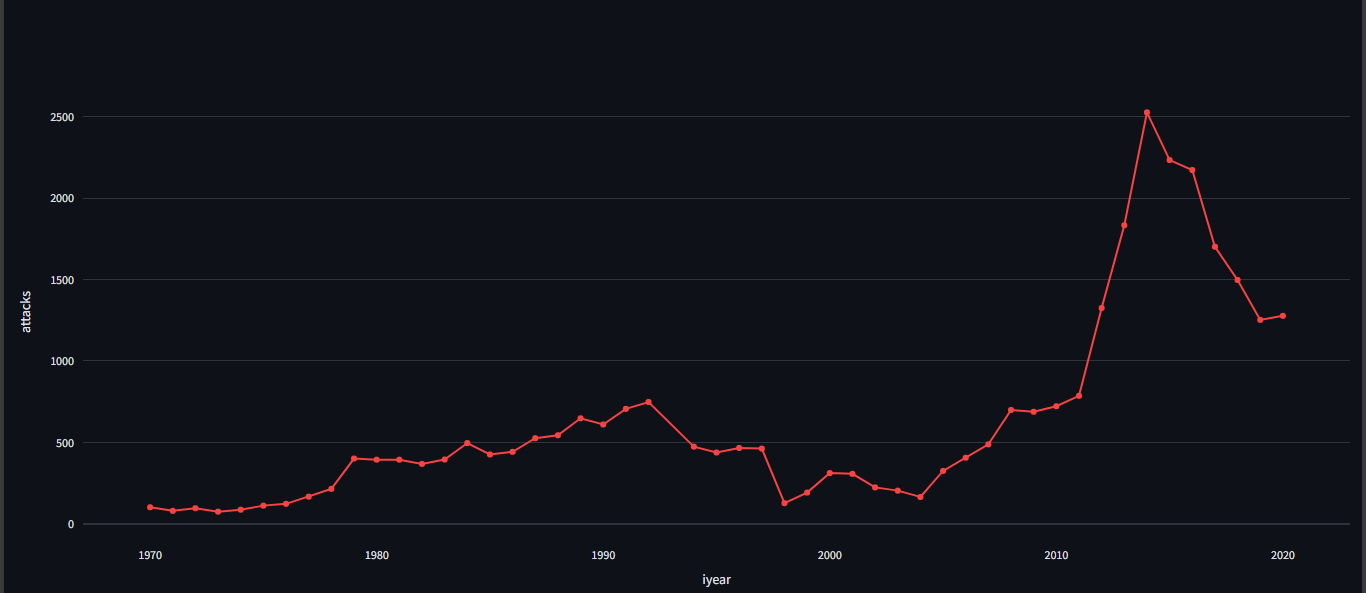
over the years terrorism
-
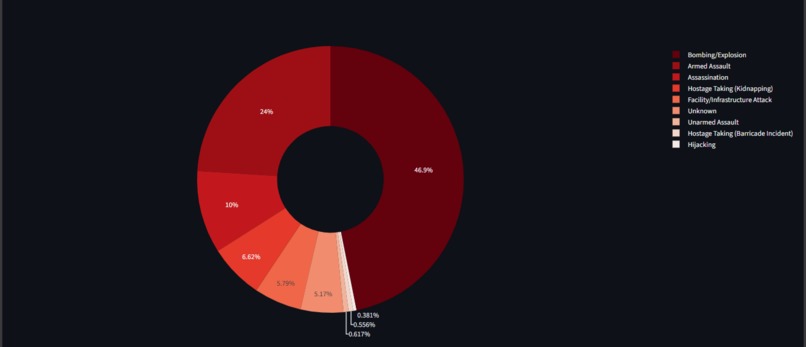
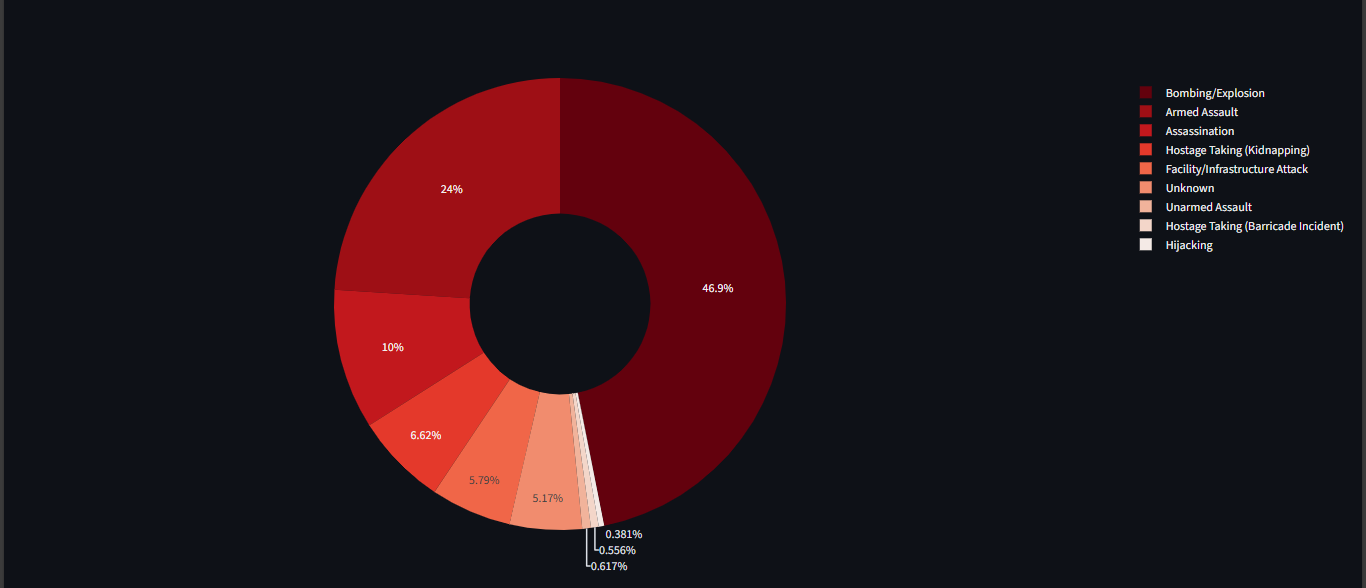
types of attacks
-
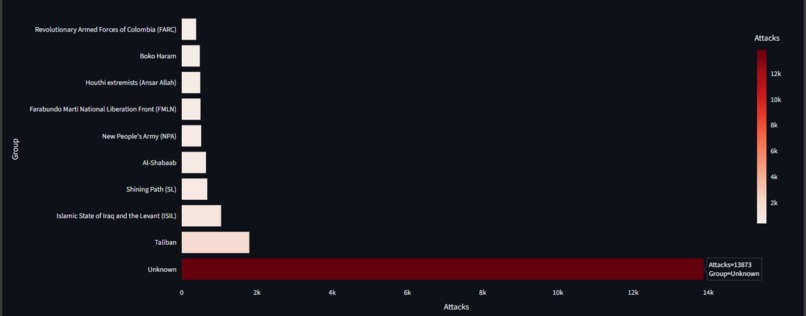
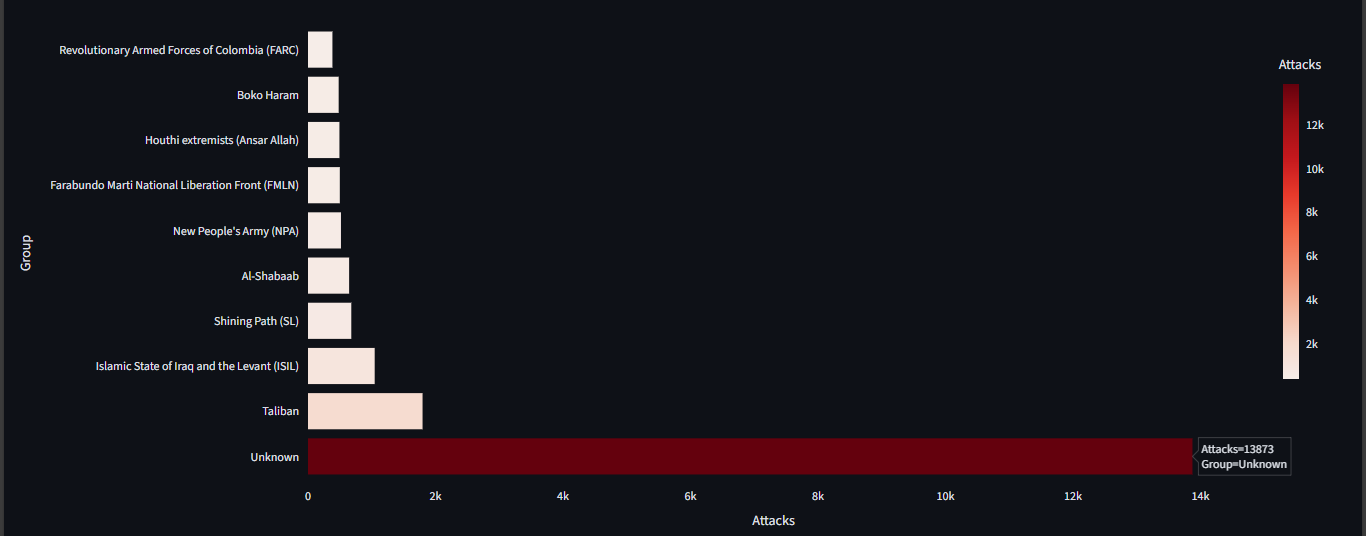
groups involvement
-
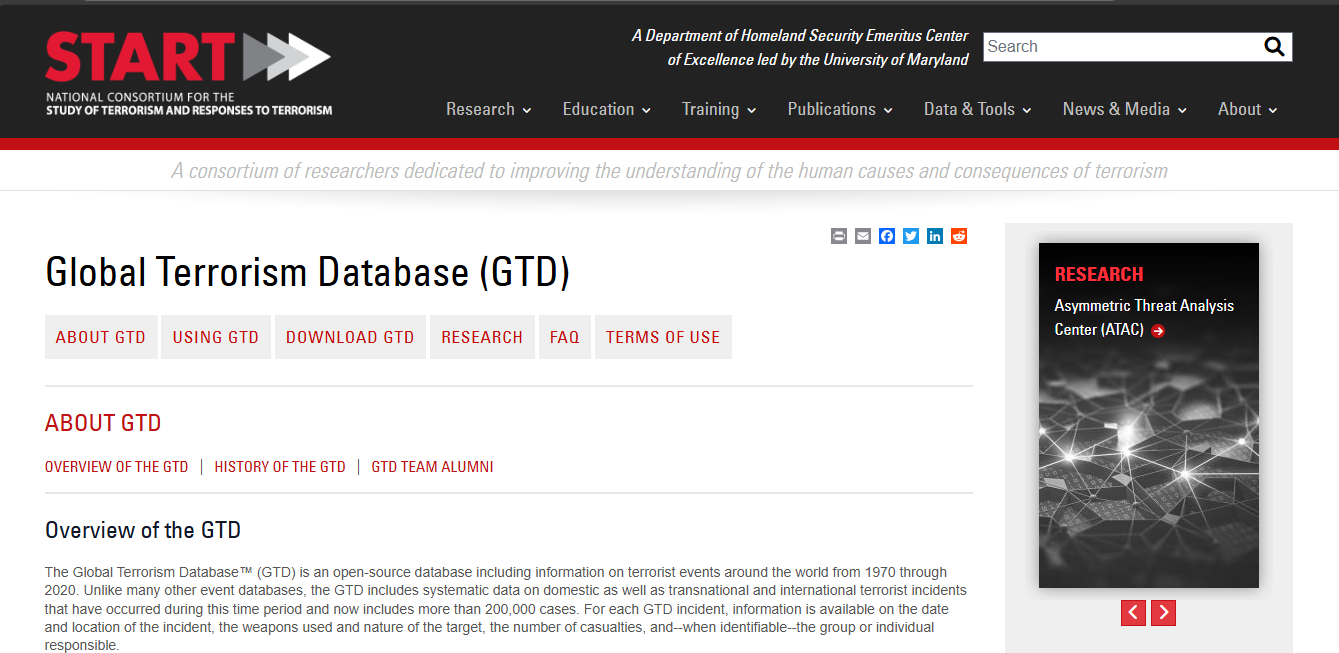
data
-
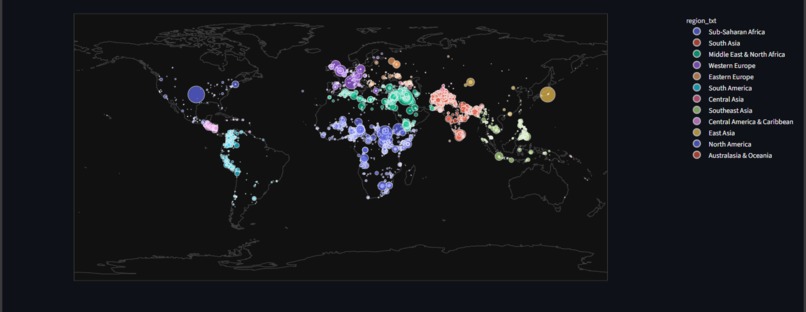
attacks all across the globe
-
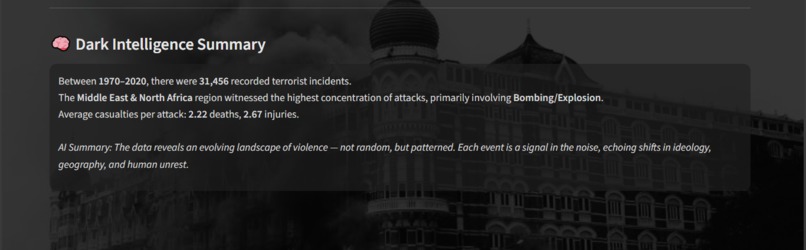
AI summary
-
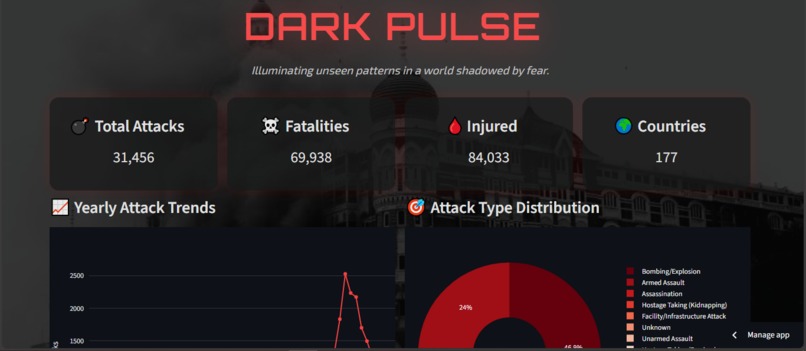
APP
-
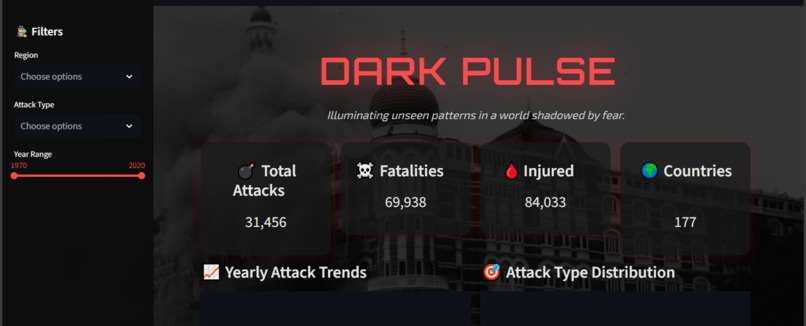
filters
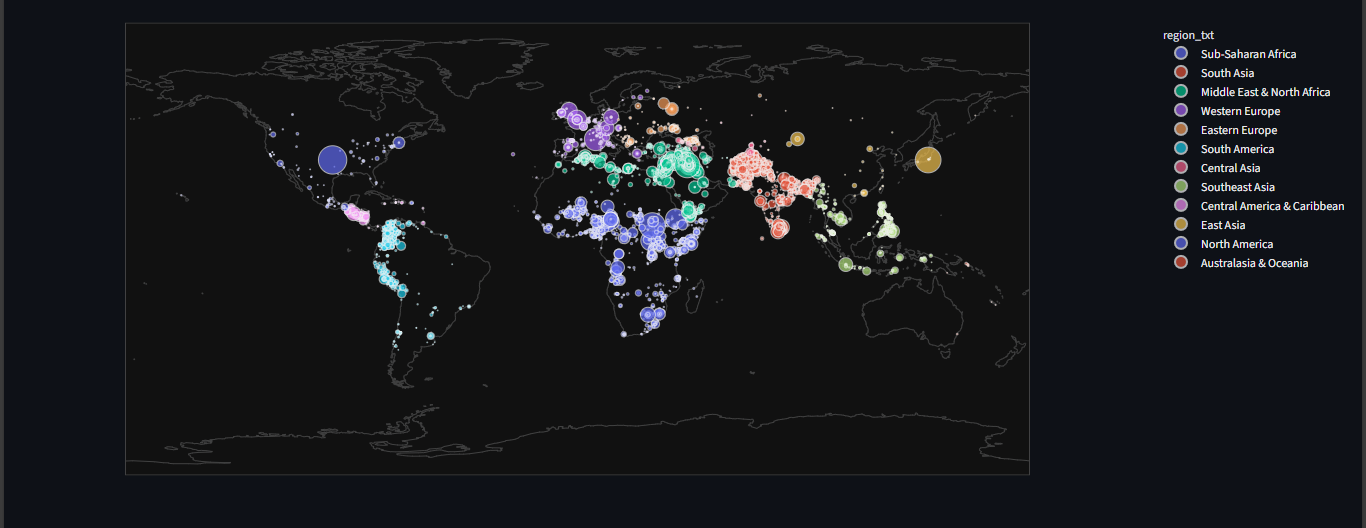
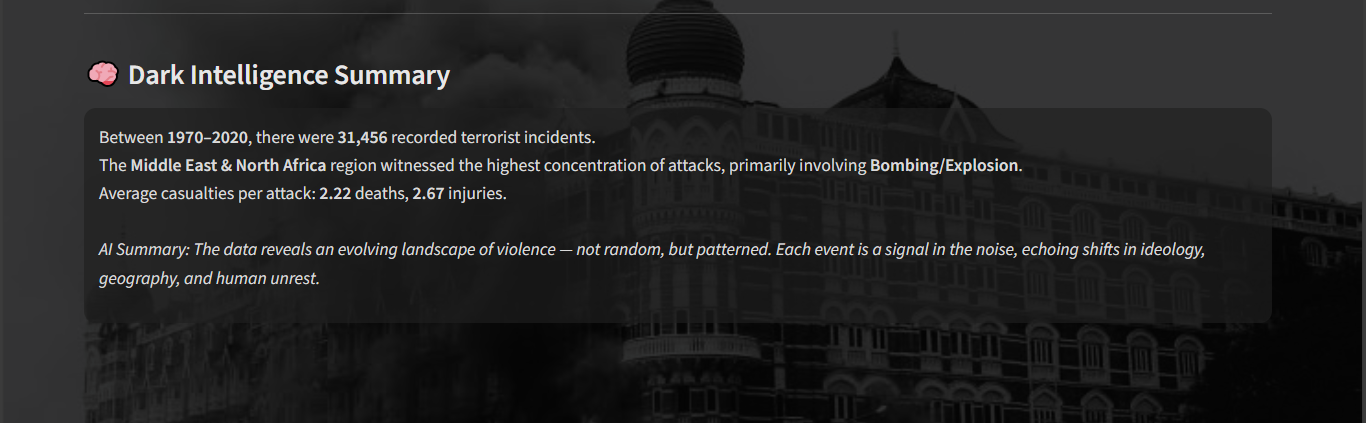
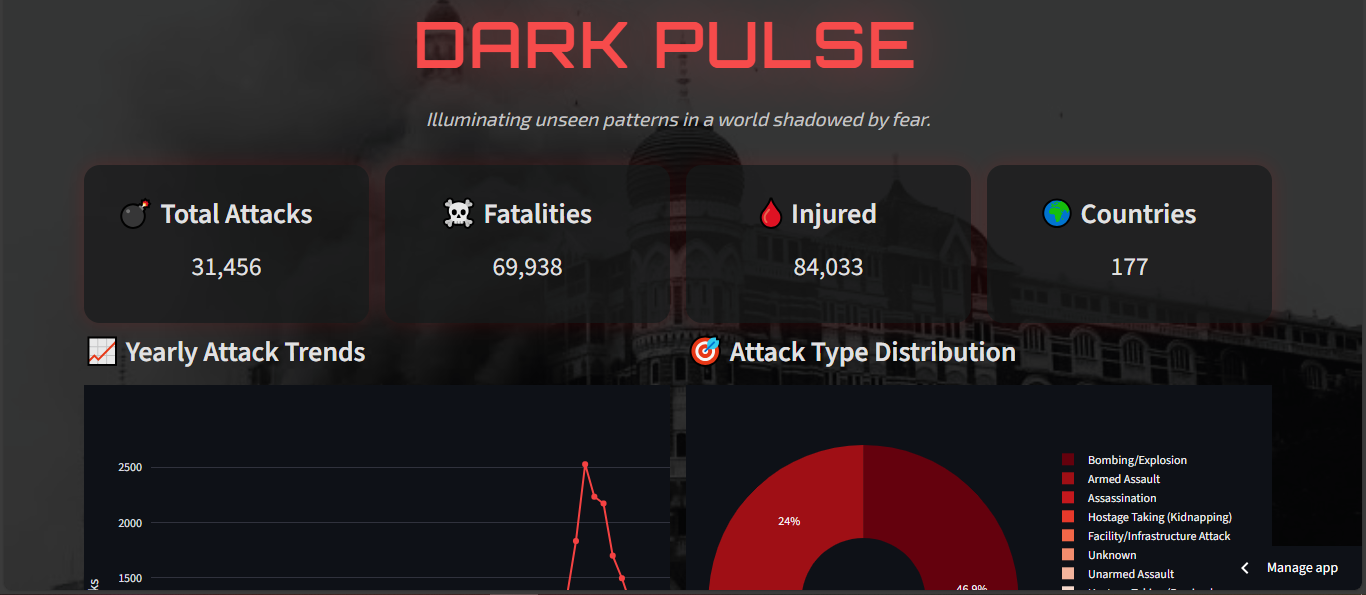
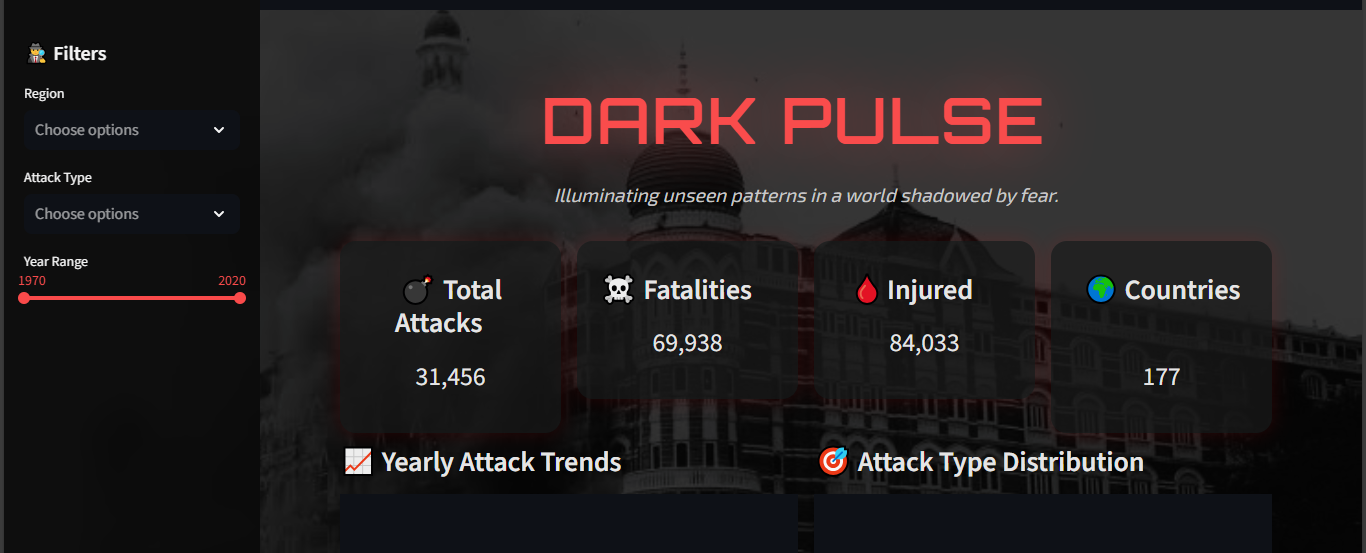
Project Title: Dark Pulse Tagline: Illuminating unseen patterns in a world shadowed by fear
Project Overview: Dark Pulse is a data-driven research and visualization project designed to analyze and interpret terrorism trends using the Global Terrorism Database (GTD). The project aims to identify temporal, regional, and behavioral patterns in terrorist activities across the world, while maintaining a human and ethical perspective toward the data. By combining statistical modeling, machine learning, and interactive dashboards, the project transforms large, complex data into actionable insights that could help policymakers, analysts, and researchers understand evolving threat dynamics.
Inspiration: In November 2008, my family and I were in Mumbai during the tragic Taj Hotel terrorist attacks. My father, who was serving in the Indian Navy at the time, was directly involved in the tense aftermath that followed. Experiencing that fear and uncertainty as a child, while witnessing the courage of those who stood against terror, left a deep and lasting impact on me. Coming from a military background, I have always been sensitive to issues related to terrorism, war, and crimes against humanity. This personal experience became the core inspiration behind Dark Pulse. Through this project, I wanted to use data science not just as a technical skill, but as a tool to explore, understand, and possibly contribute to preventing future tragedies. For me, Dark Pulse is more than an analysis — it is an act of remembrance, empathy, and pursuit of peace through understanding.
How I Built It: The project began with the collection and preprocessing of data from the Global Terrorism Database, which contains over 90,000 recorded incidents worldwide. Using Python and libraries like Pandas and NumPy, the data was cleaned, standardized, and structured into a usable analytical format. In the descriptive phase, I calculated key statistical indicators such as total attacks per year, mean and median casualties, most affected regions, and the most active terror groups. Visualization was a core focus of this project. Using Plotly and Streamlit, I built an interactive dashboard that displays global attack hotspots, temporal trends, and network relationships between groups, regions, and attack types. The machine learning phase involved using clustering algorithms like K-Means and DBSCAN to identify patterns among regions and terror groups with similar behavioral profiles. Time series modeling and predictive analytics were also implemented using Statsmodels to forecast future trends based on historical data. Finally, the project was deployed via Streamlit Cloud for public interaction.
What I Learned: Working on Dark Pulse taught me how technical tools and human stories can coexist in data science. I learned how to clean and manage extremely large datasets, engineer meaningful features, and apply machine learning models for unsupervised pattern discovery. I also deepened my understanding of statistical inference, data visualization, and storytelling through analytics. Beyond the technical learning, this project reinforced the importance of ethical responsibility when dealing with sensitive data related to loss and violence. I learned that presenting such data requires balance — to inform, not to sensationalize.
Challenges Faced: The biggest challenge was managing the size and inconsistency of the dataset. The Global Terrorism Database contains missing values, inconsistent country names, and mixed data types, all of which required careful preprocessing. Handling large CSV files in Streamlit also caused performance issues, requiring optimization and data sampling. Another challenge was designing visualizations that captured complexity while remaining clear and interpretable. Lastly, the ethical challenge of working with terrorism data required maintaining respect for the victims while focusing on the analytical aspect.
Technologies and Tools Used: The project was developed primarily in Python, using libraries such as Pandas, NumPy, Plotly, Seaborn, Matplotlib, Scikit-learn, and Statsmodels. Streamlit was used for building the interactive dashboard and deploying it online via Streamlit Cloud. GitHub was used for version control and project hosting. The data was stored and processed in CSV format, while visualization utilized Plotly’s Mapbox API for geospatial mapping. Jupyter Notebook and Visual Studio Code served as the main development environments, and Markdown with LaTeX was used for documentation and mathematical representation. SQL was occasionally used for querying structured subsets of the dataset.
Future Scope: Dark Pulse can be extended into a real-time terrorism monitoring system by integrating live data streams through APIs. Large Language Models (LLMs) and Natural Language Processing (NLP) techniques can be used to summarize new incidents automatically. Future work could also include building a socio-economic correlation model by combining GTD data with indicators from sources like the UN or World Bank. With cloud integration and interactive visual dashboards, the project could serve as a public educational tool or early warning system prototype.
Closing Note: In the shadows of fear, data can become light. Dark Pulse is my attempt to let that light reveal truth — not to glorify terror, but to understand it, to remember, and to prevent it.

Log in or sign up for Devpost to join the conversation.