
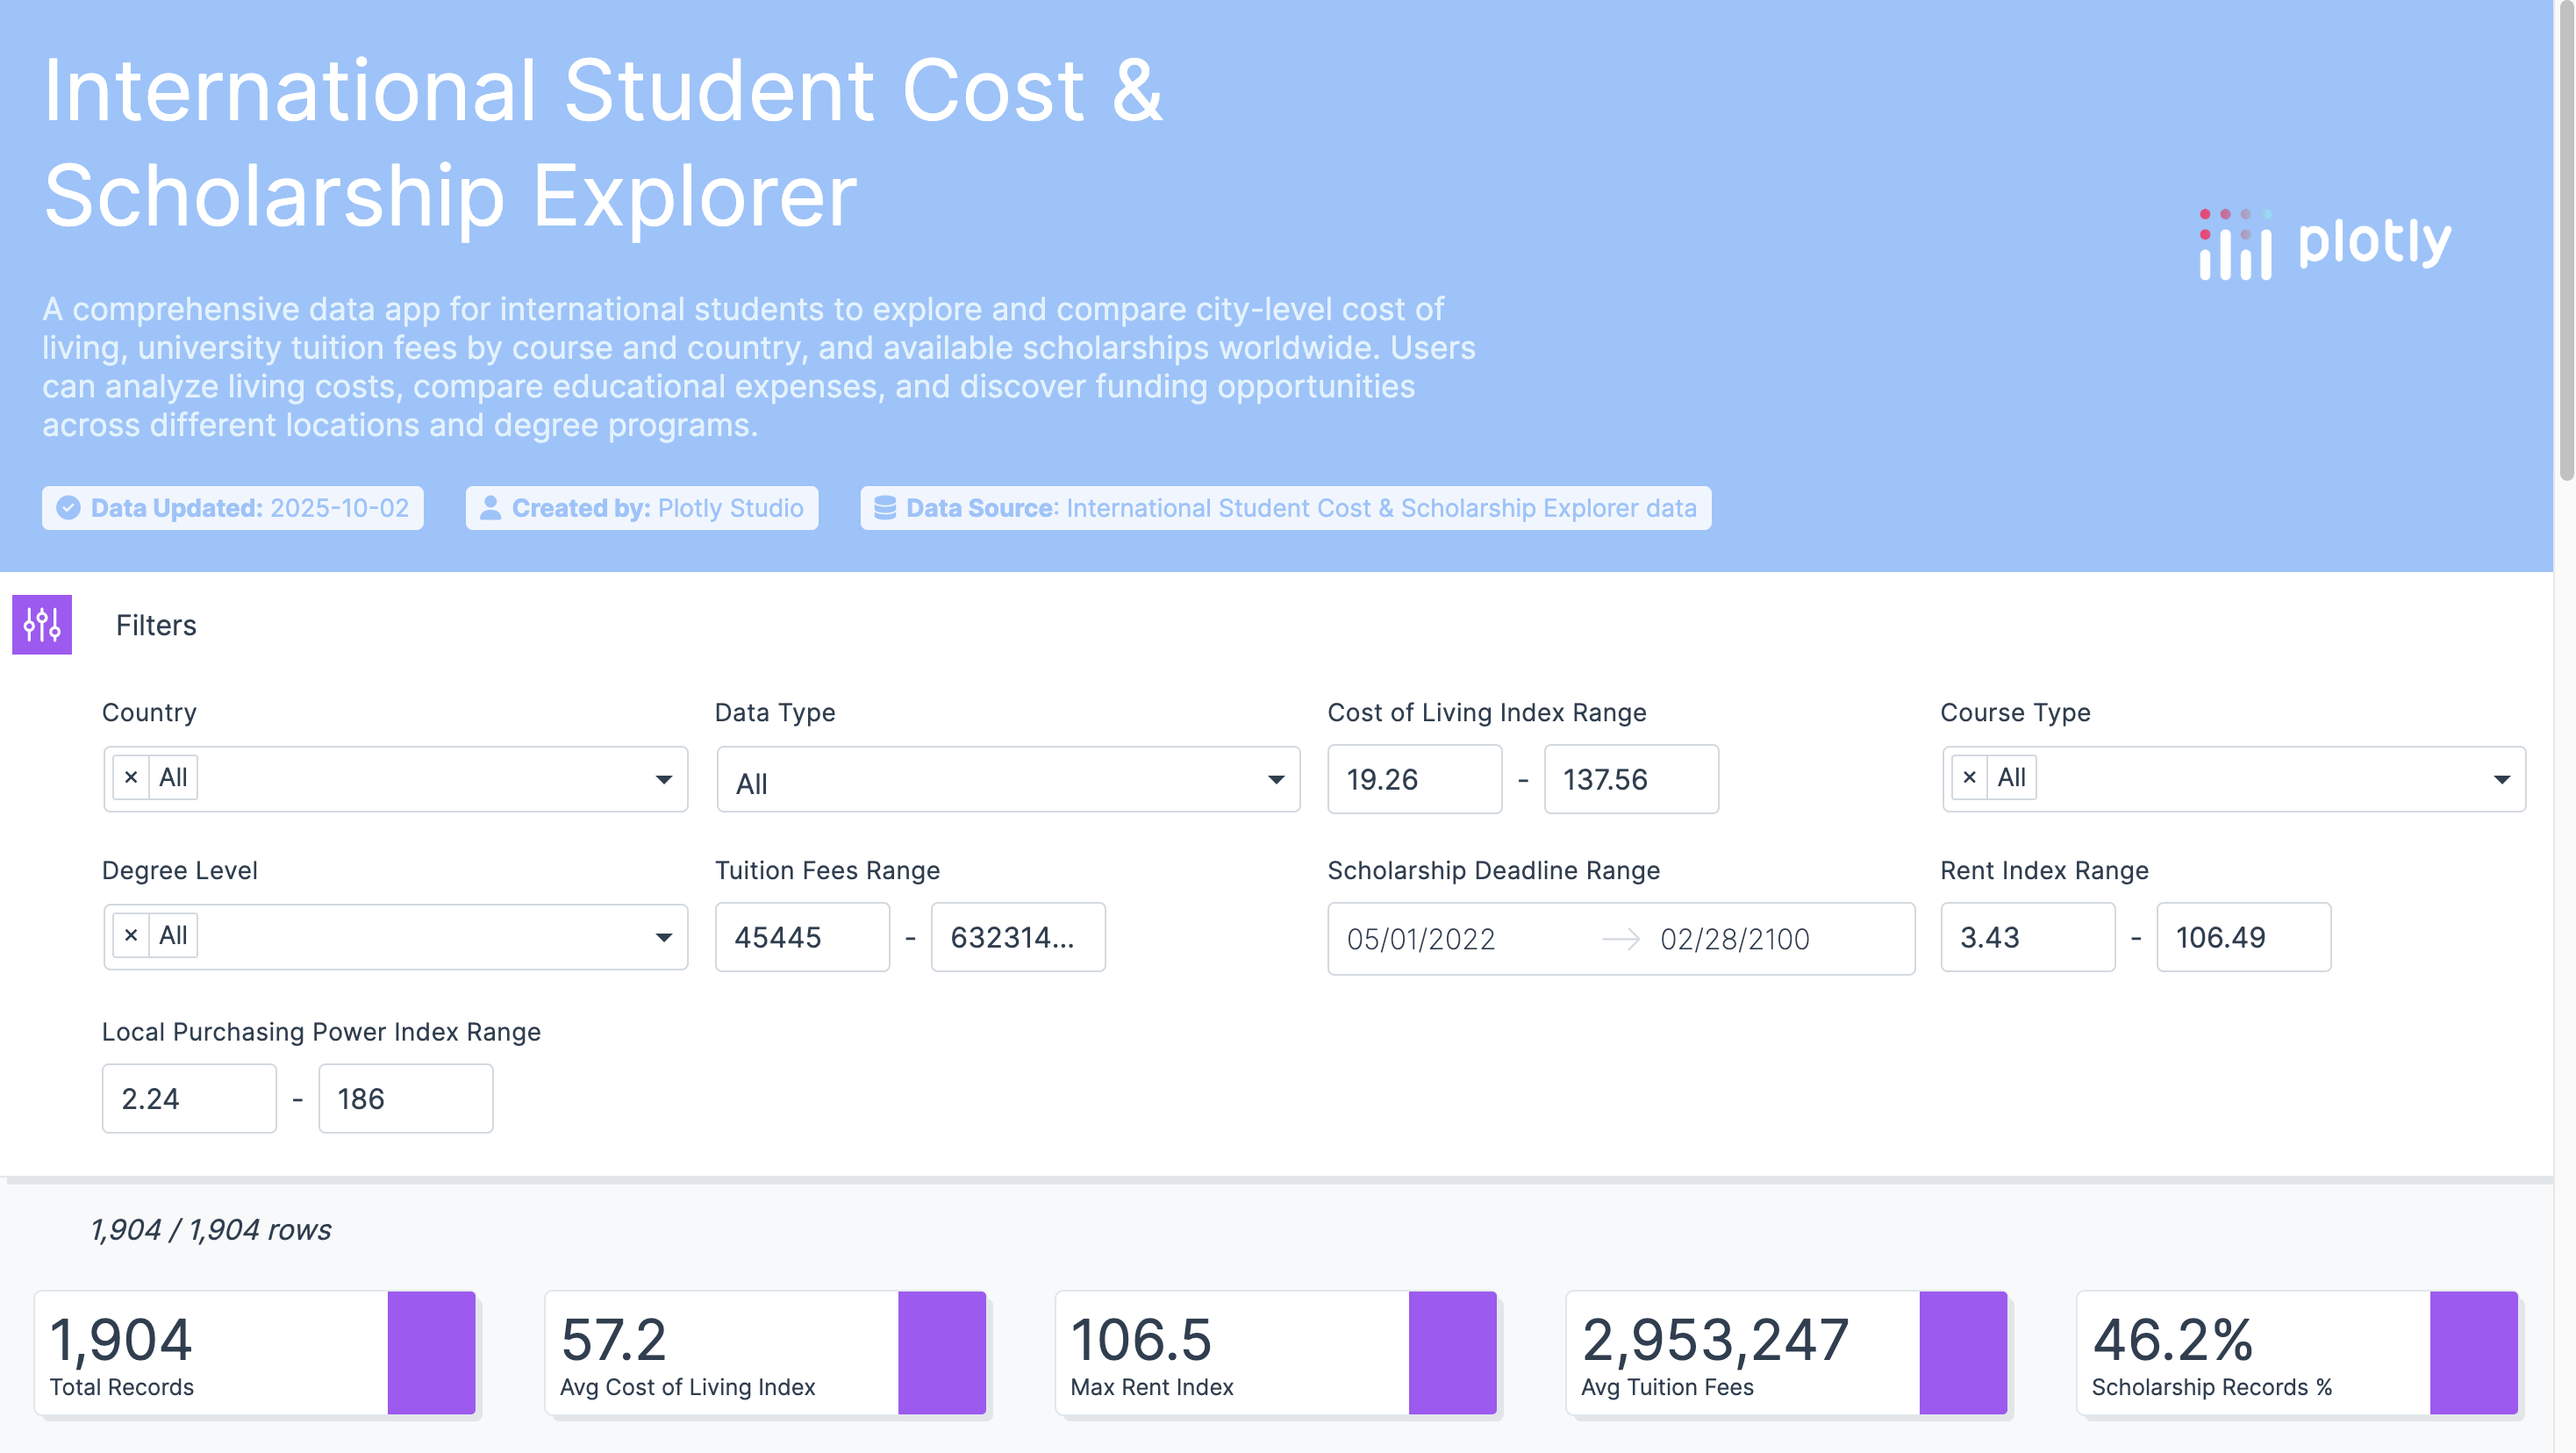
🌍 International Student Cost & Scholarship Explorer
💡 Inspiration
I’m an international student myself 🎒🌎 and I know first-hand how confusing it is to figure out tuition, living costs, and scholarships when looking at schools abroad. Instead of juggling dozens of tabs, I wanted a single place to see everything.
🚀 What It Does
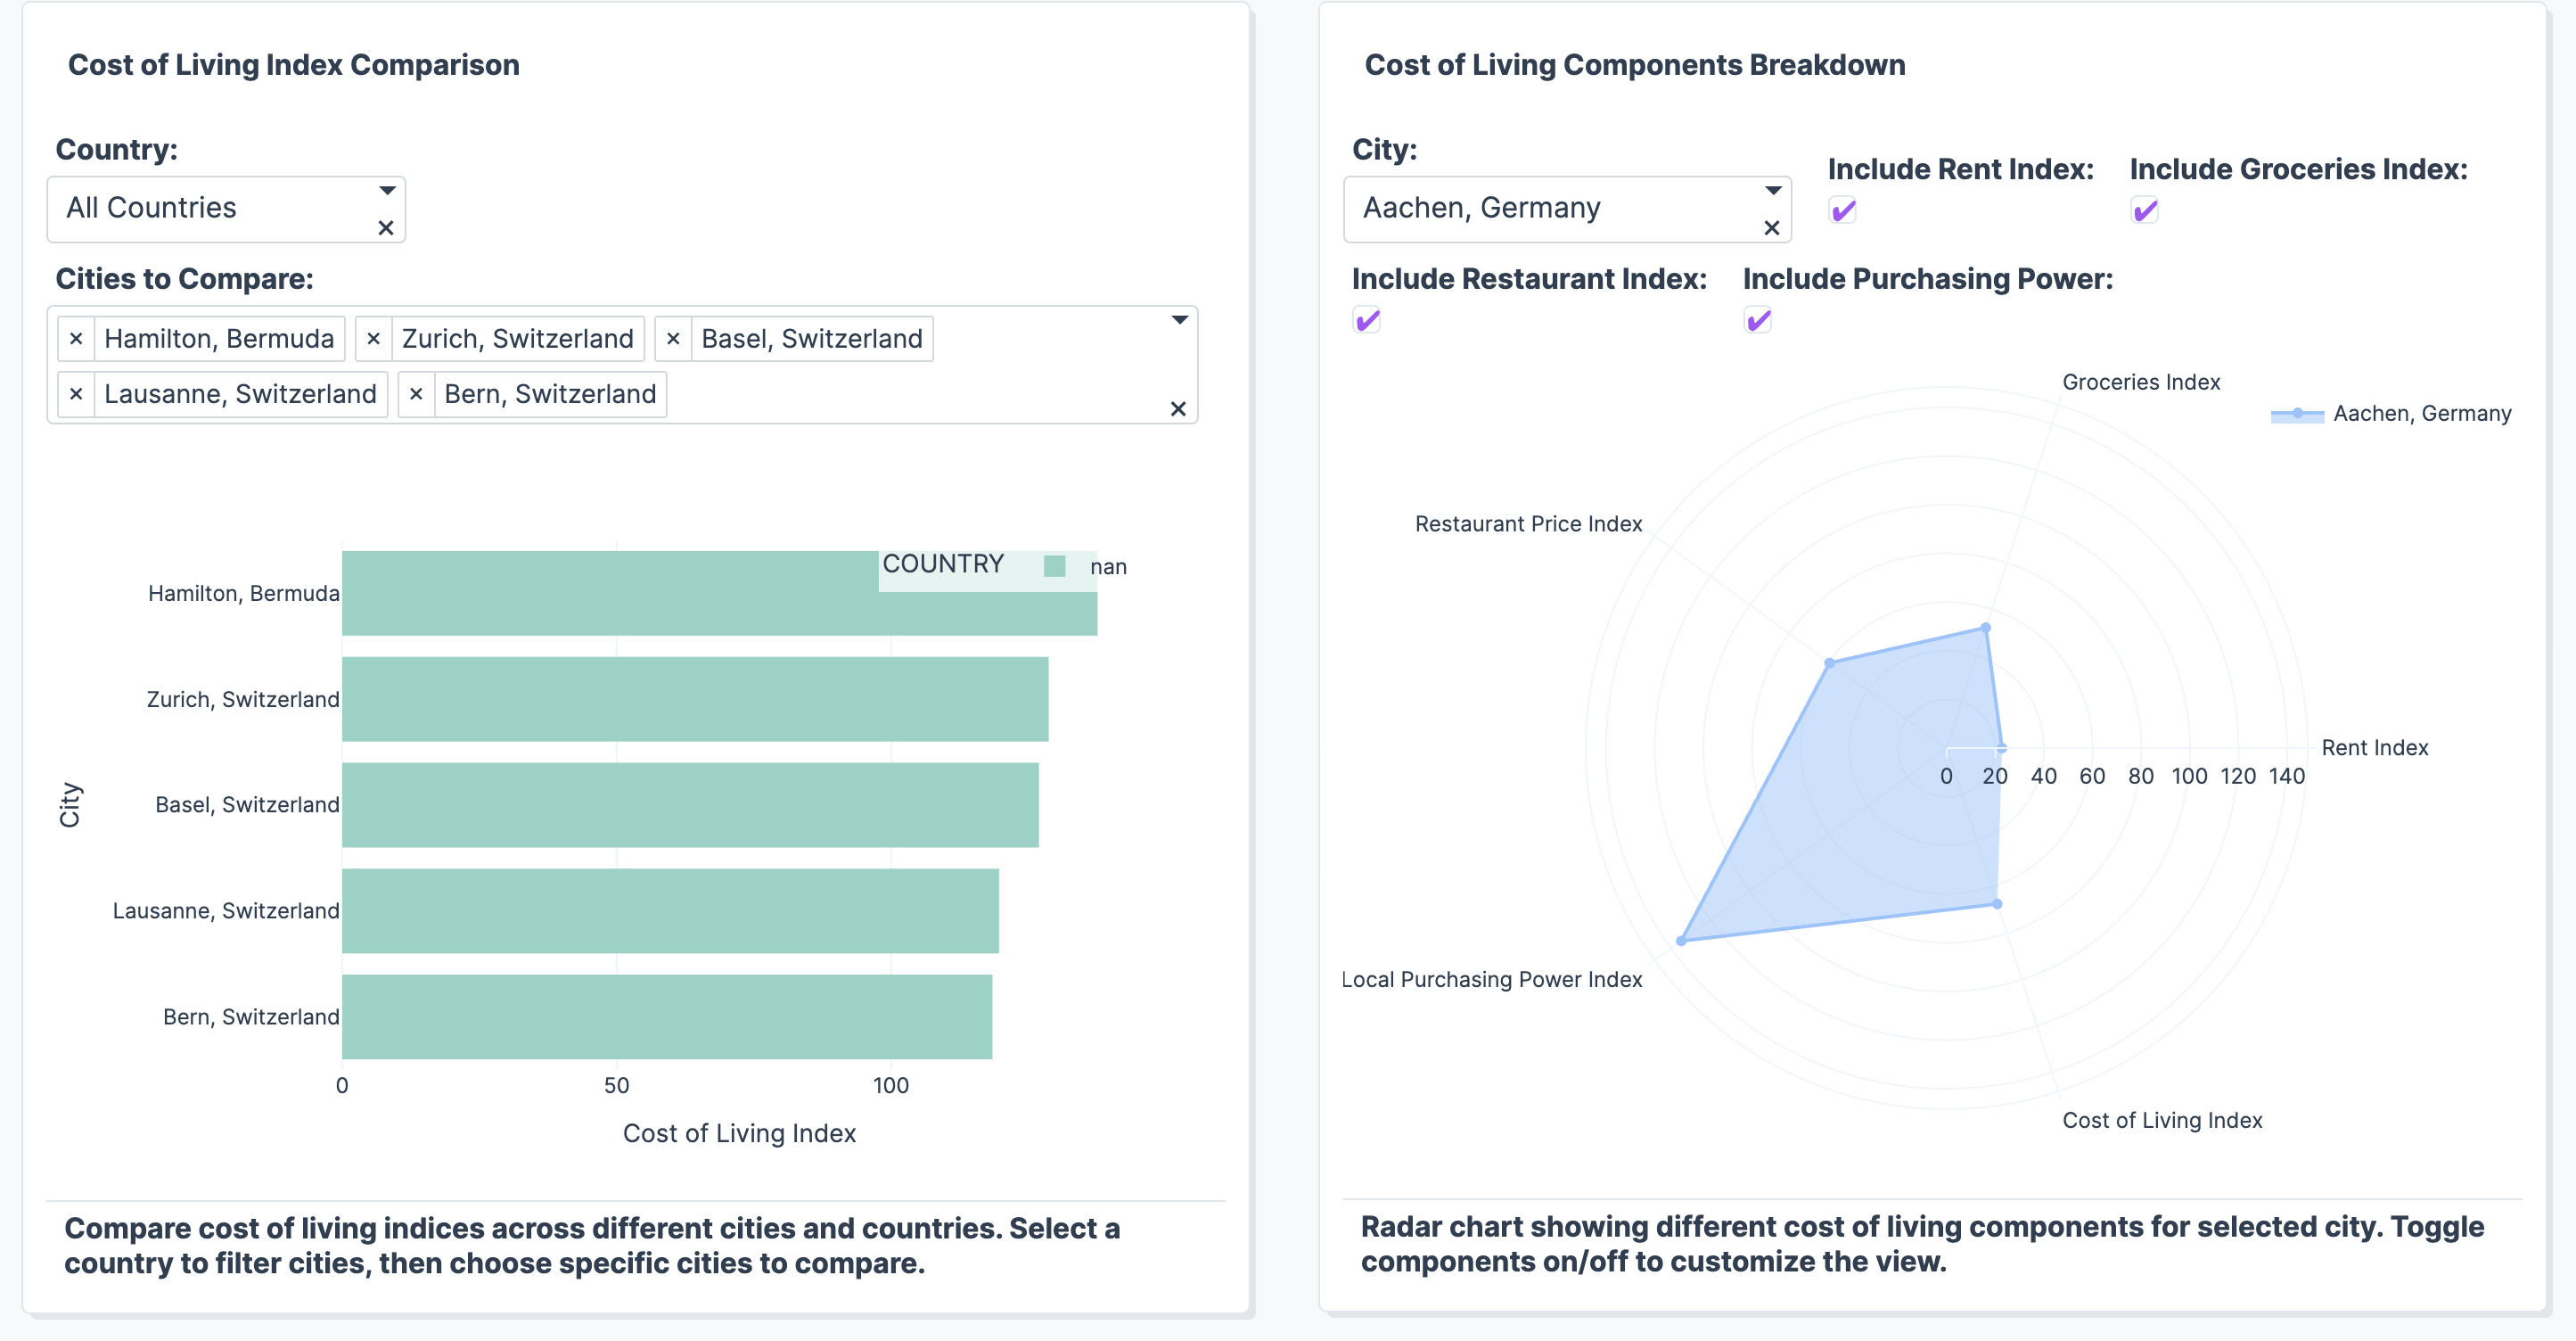
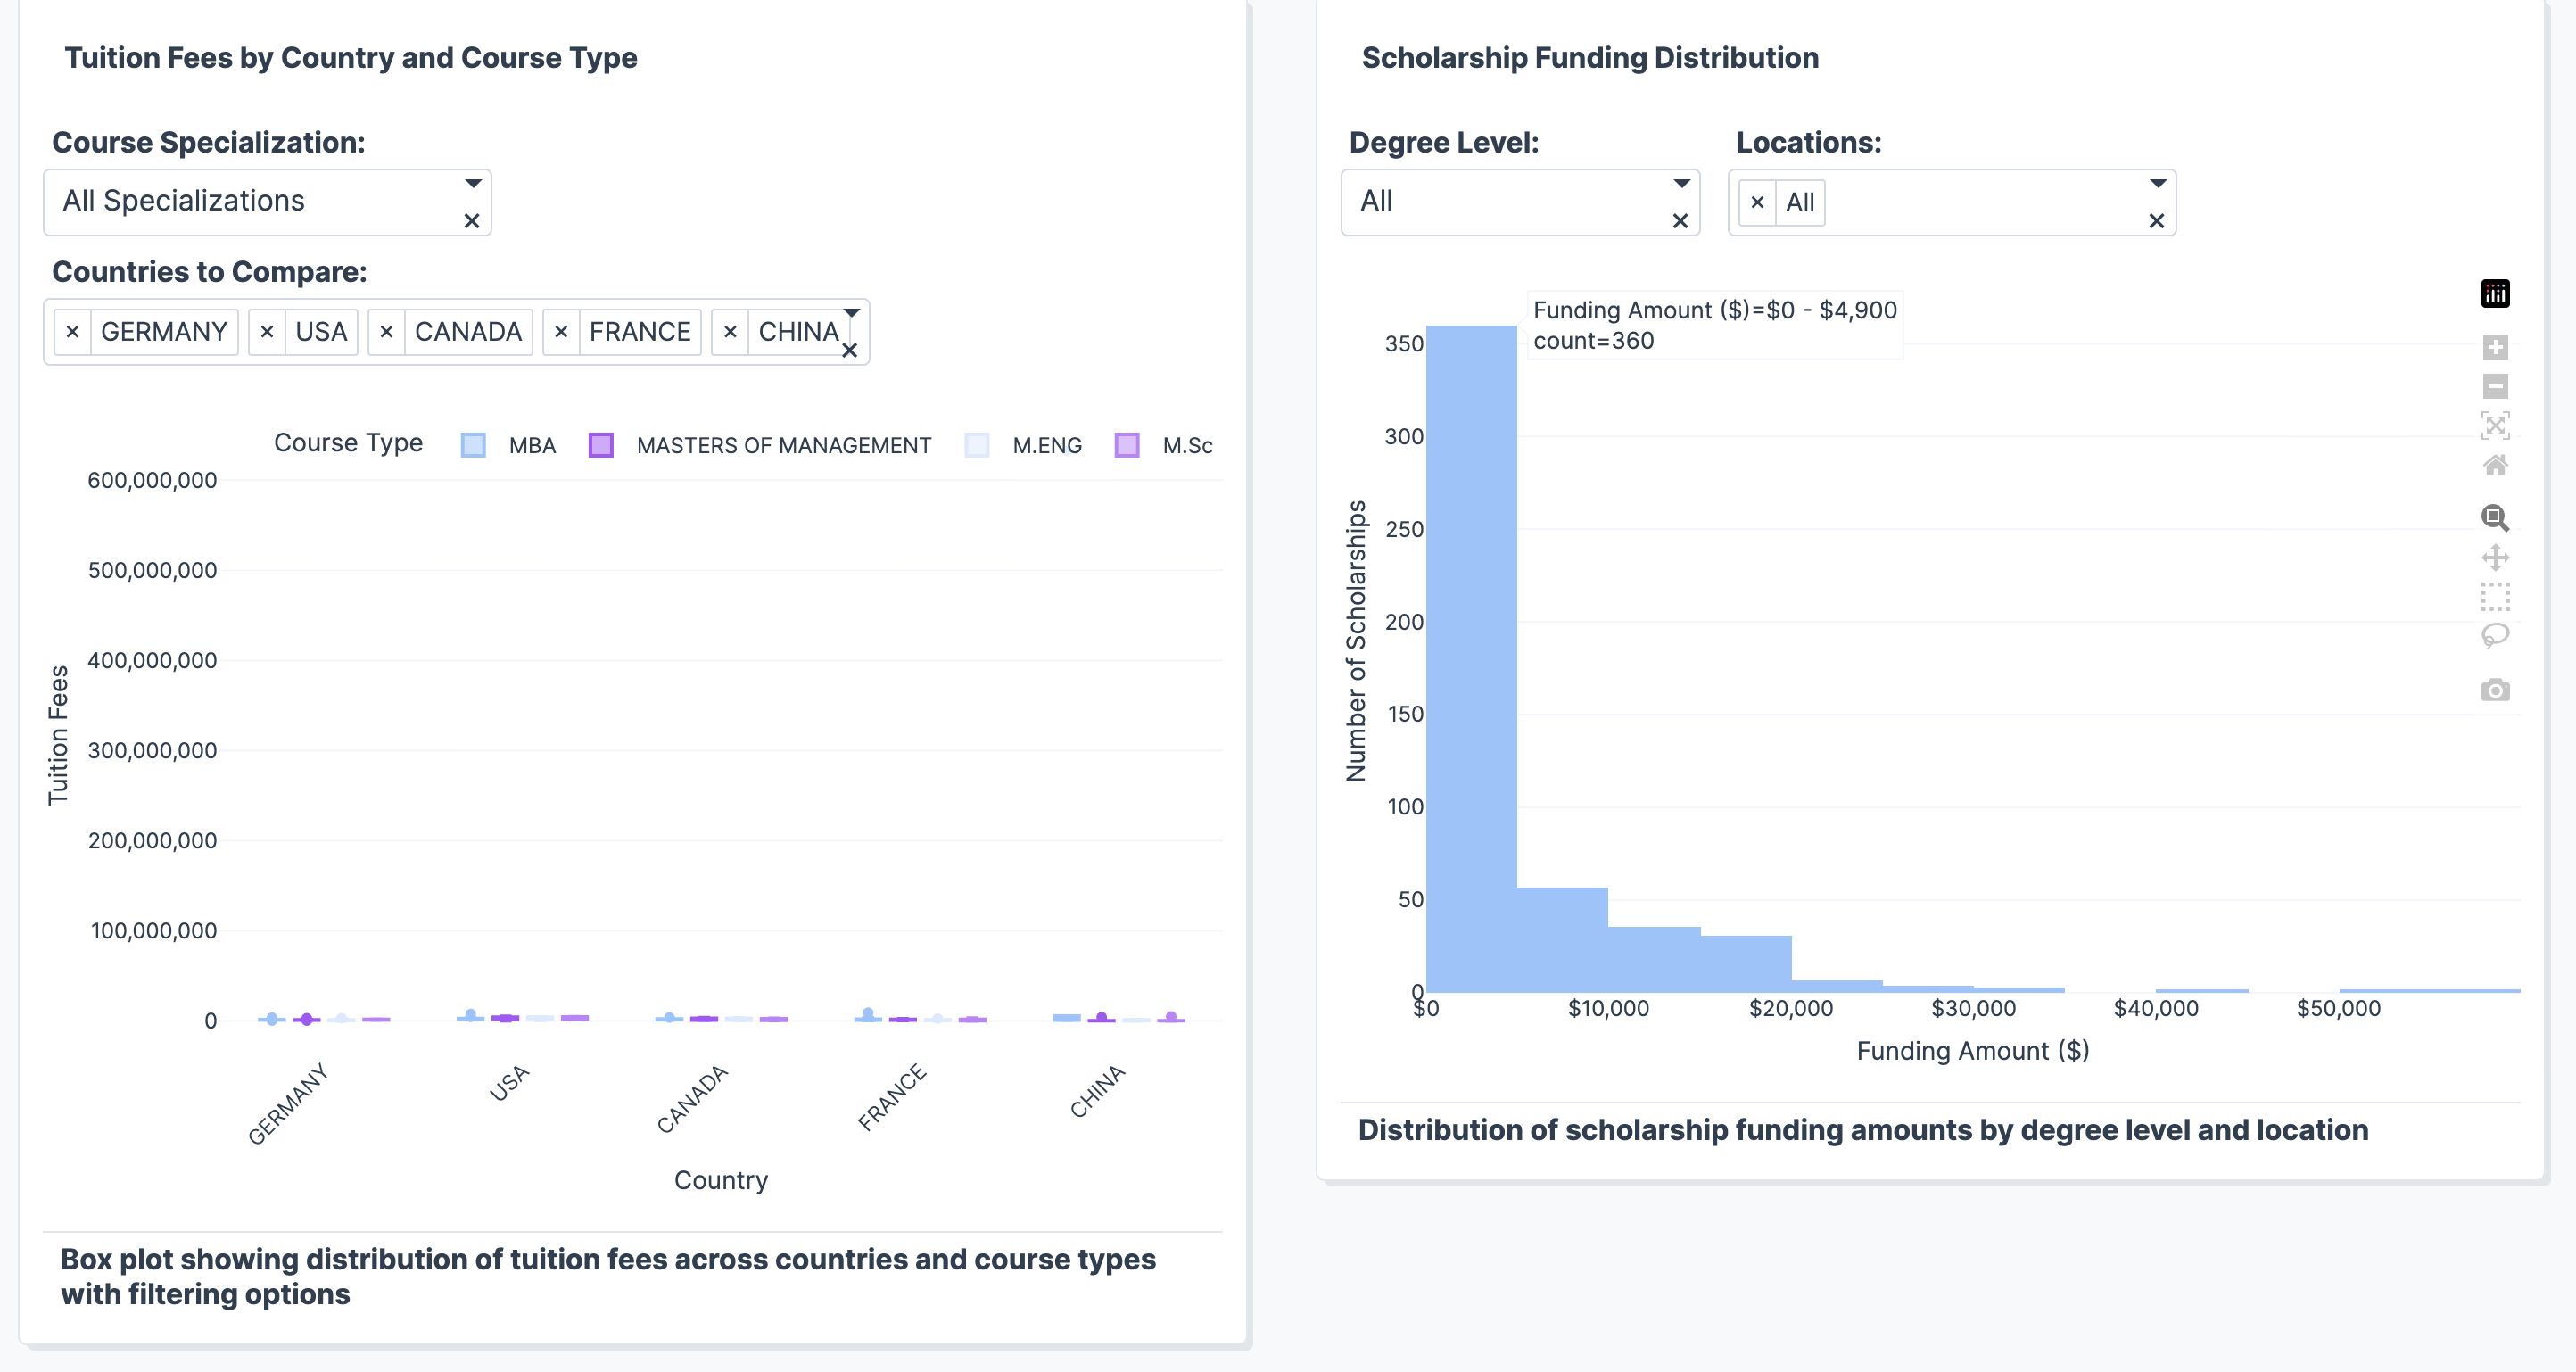
This app lets you instantly compare tuition fees, living costs, and scholarships across cities, universities, and degree types. You can see how scholarships actually cut your expenses and even check upcoming deadlines — almost like Google Flights, but for your education journey ✈️📚.
🛠️ How I Built It
This is a solo project 🙋♀️:
- Started from my own pain point to choose the topic
- Researched and combined open datasets (kaggle)
- Decided which columns to include and which charts tell the story best
- Generated the first version in Plotly Studio with a clear prompt, then refined with edits to build a clean interactive app
⚡ Challenges I Ran Into
Choosing the right datasets and deciding which chart type would show each insight best were the biggest hurdles 🤯. Balancing clarity and depth with a limited time window was also tricky.
Link to the final datasets used:
- https://www.kaggle.com/datasets/timmofeyy/-universities-schoolarships-all-around-the-world
- https://www.kaggle.com/code/anandaramg/cost-of-living/notebook
- https://www.kaggle.com/code/adilshamim8/cost-of-studying-abroad/input
🏆 Accomplishments I’m Proud Of
I built a fully working data app solo — from idea to data collection to interactive dashboards — that genuinely helps other students like me 💪🎓.
📚 What I Learned
Plotly Studio is an incredibly powerful tool for turning raw CSVs into beautiful, interactive apps fast. I also learned a lot about data storytelling; how the right visualization can completely change how people understand costs and scholarships.
🔮 What’s Next
- Add more countries, cities, and scholarships 🗺️
- Integrate real-time currency conversion 💱
- Include a “personal budget planner” so students can plug in their own numbers
- Deploy on a custom domain and make it mobile-friendly 📱
Built With
- csv
- kaggle
- plotly


Log in or sign up for Devpost to join the conversation.