
Inspiration
The idea behind Well-being Anatomy: Navigating Global Quality of Life with Interactive OECD Insights came from analyzing the OECD Well-being dataset, which provided a rich and multidimensional view of how countries perform in a multitude of domains like health, jobs, education, environment, and life satisfaction. I wanted to and share with curious others like the anatomy of such data. My goal is to tell a story of global well-being while letting others create their own comparisons and insights.
What it does
The app transforms raw OECD data into an interactive, one-page dashboard with simple navigation. Users can:
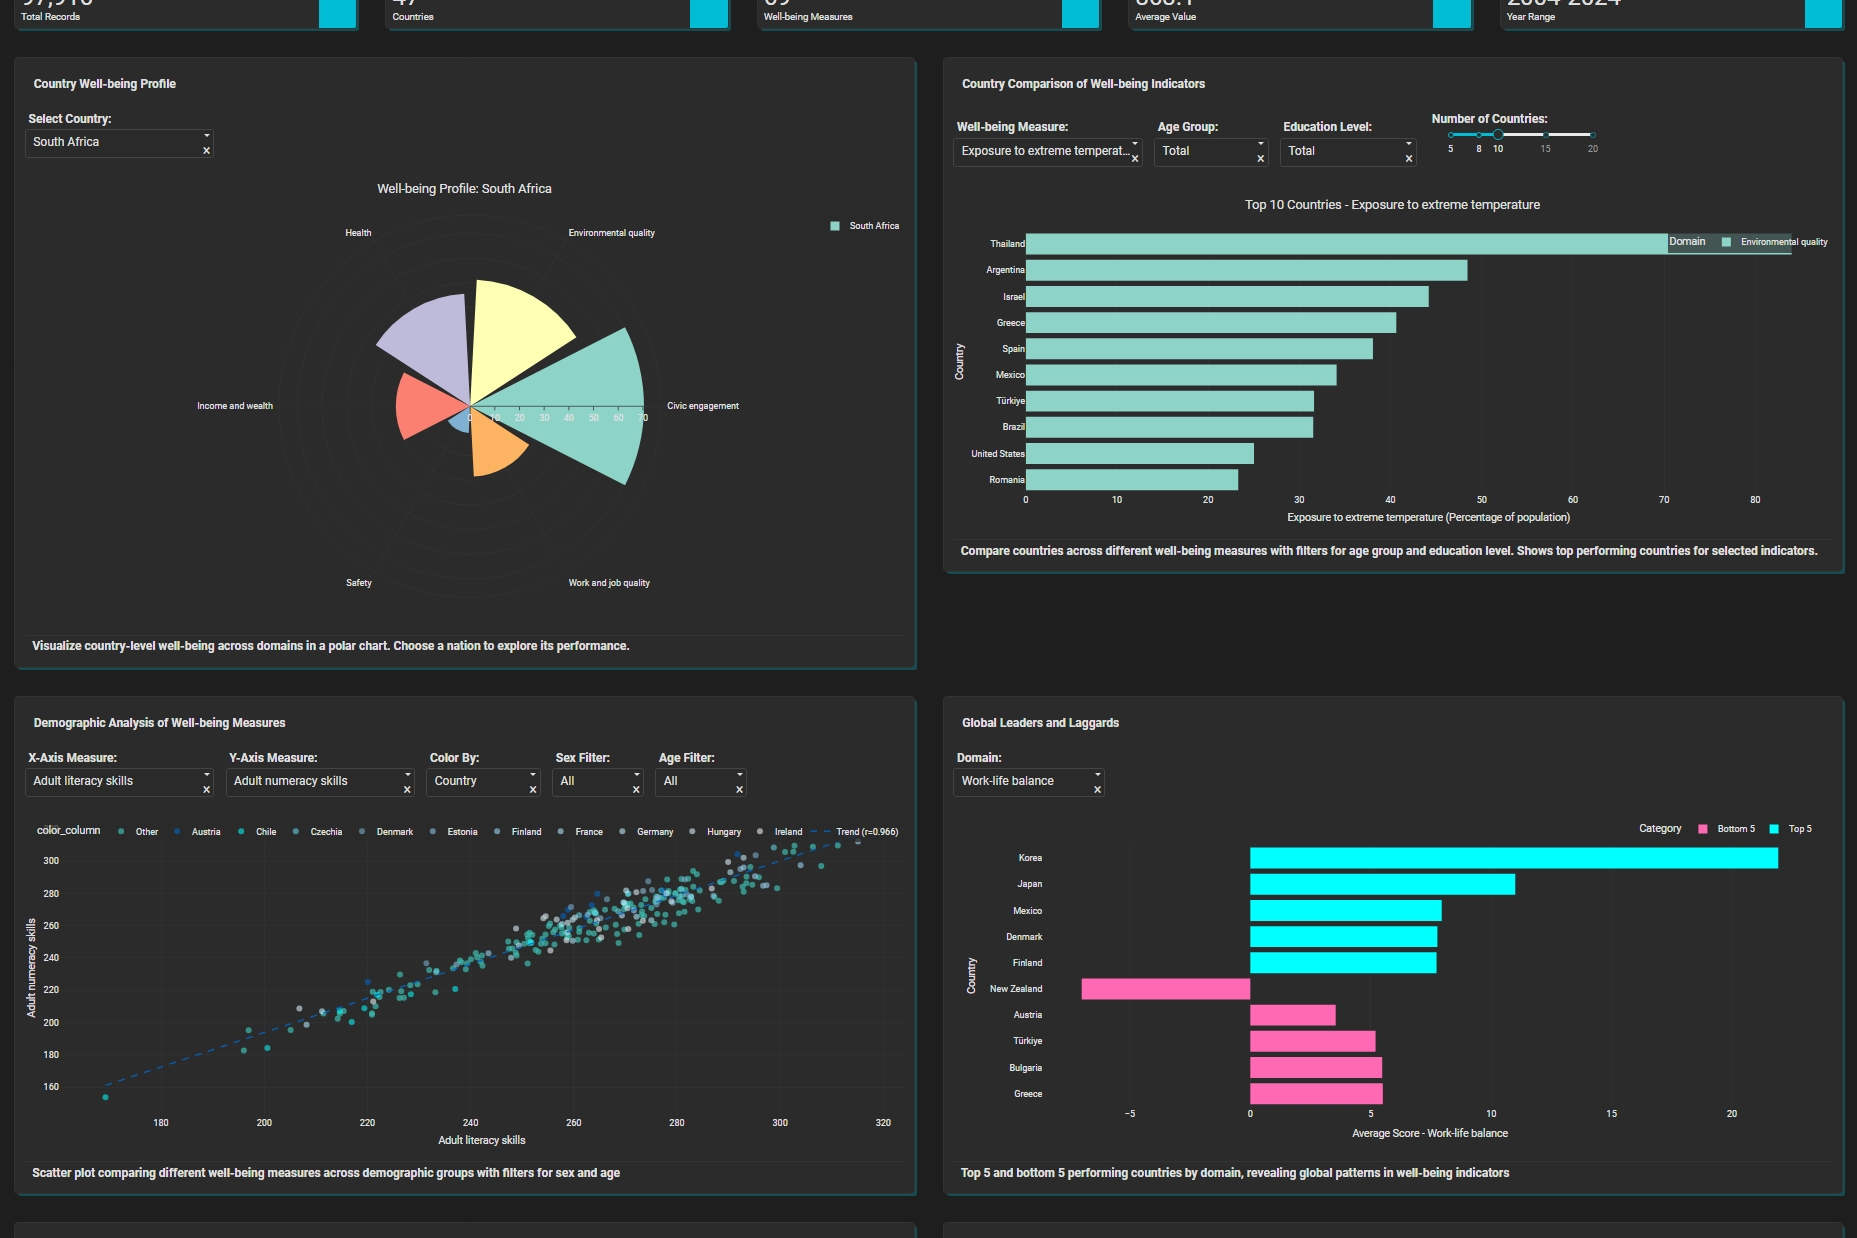
- Compare countries across different well-being with a Country Comparison of Well-being Indicators along with aditional filters for Age, Education, and Number of countries.
- Visualize country-level well-being across domains in a polar chart.
- Scatter plot comparing different well-being measures across demographic groups with filters for sex and age
- Top 5 and bottom 5 performing countries by domain, revealing global patterns in well-being indicators
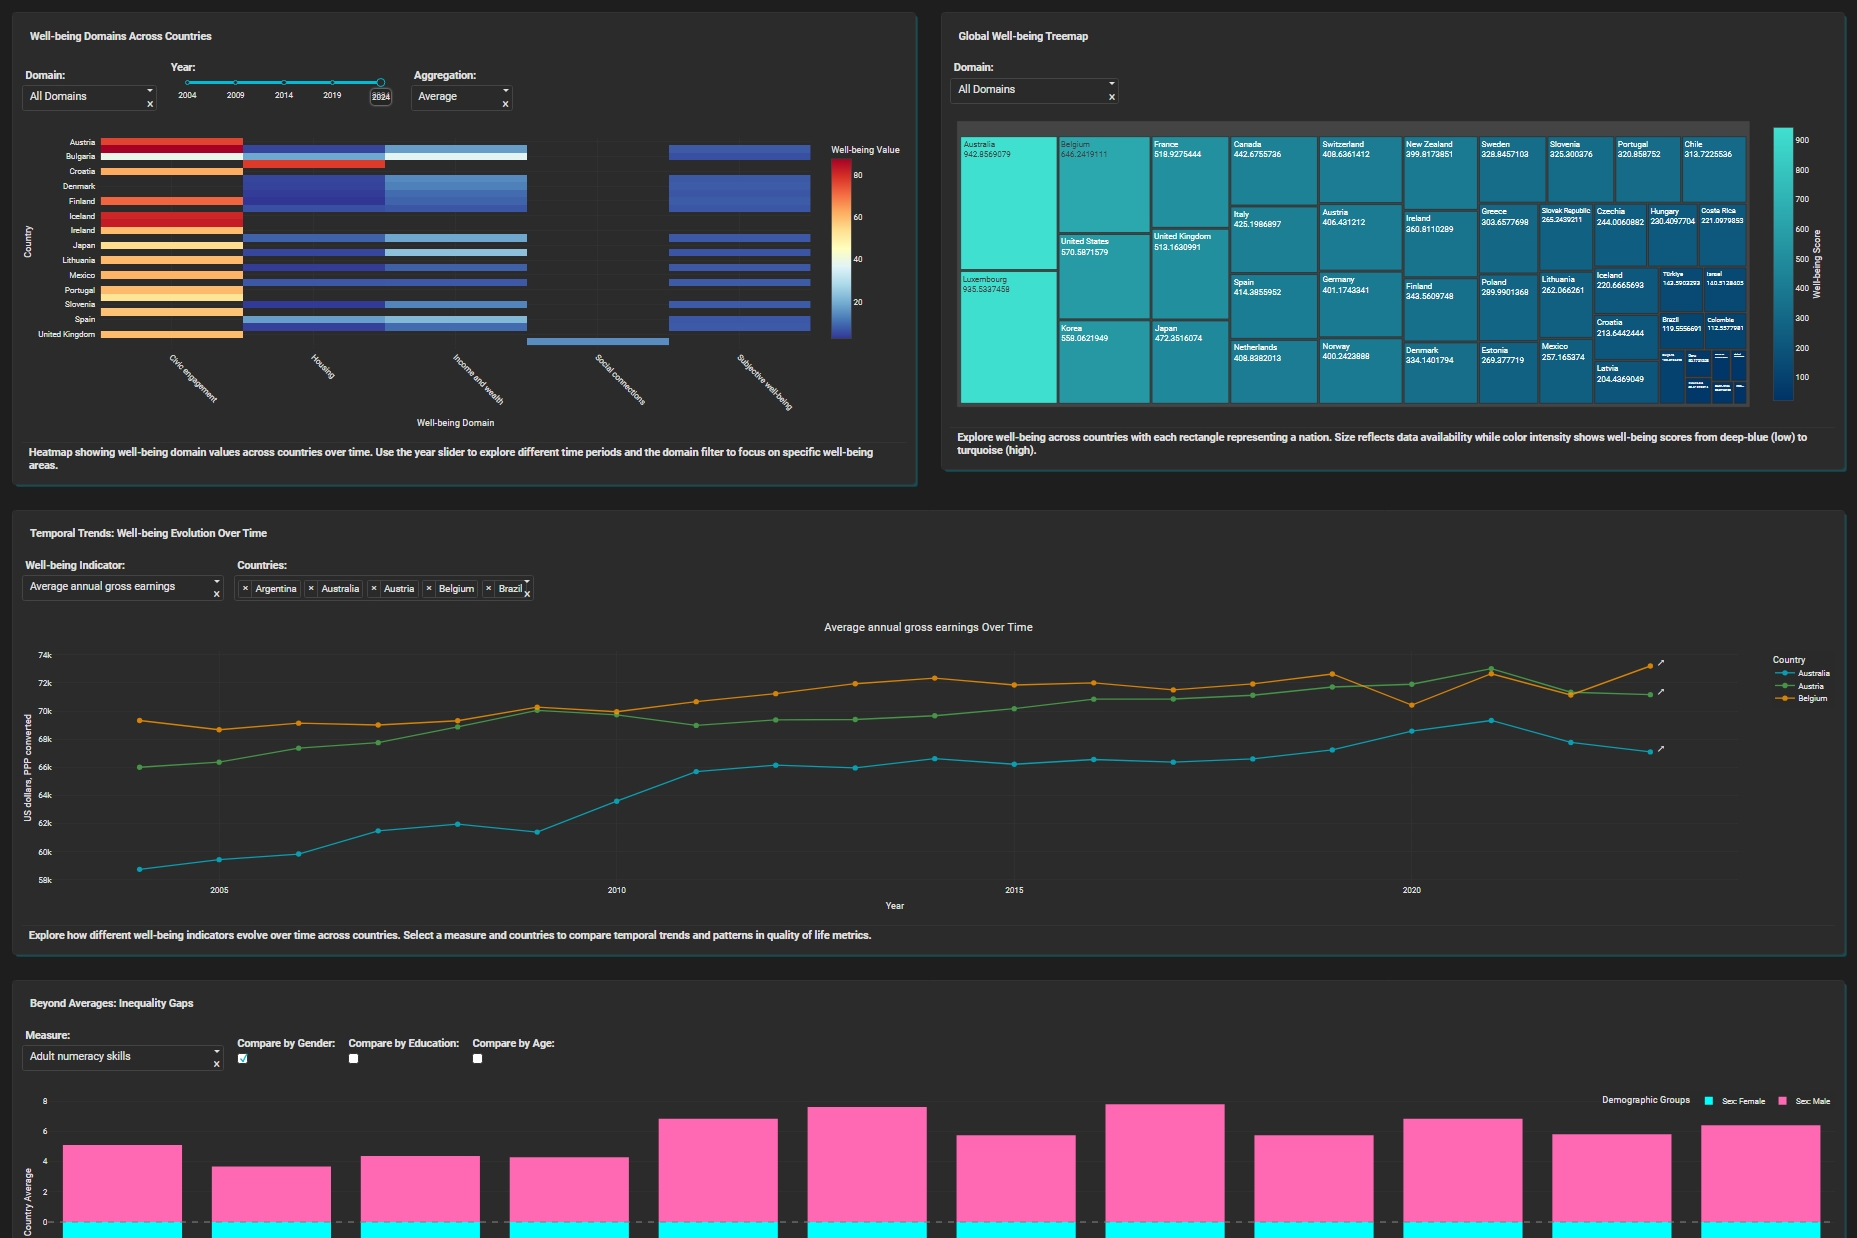
- Heatmap showing well-being domain values across countries over time. Use the year slider to explore different time periods and the domain filter to focus on specific well-being areas.
- Explore well-being across countries with Global Well-being Treemap with each rectangle representing a nation
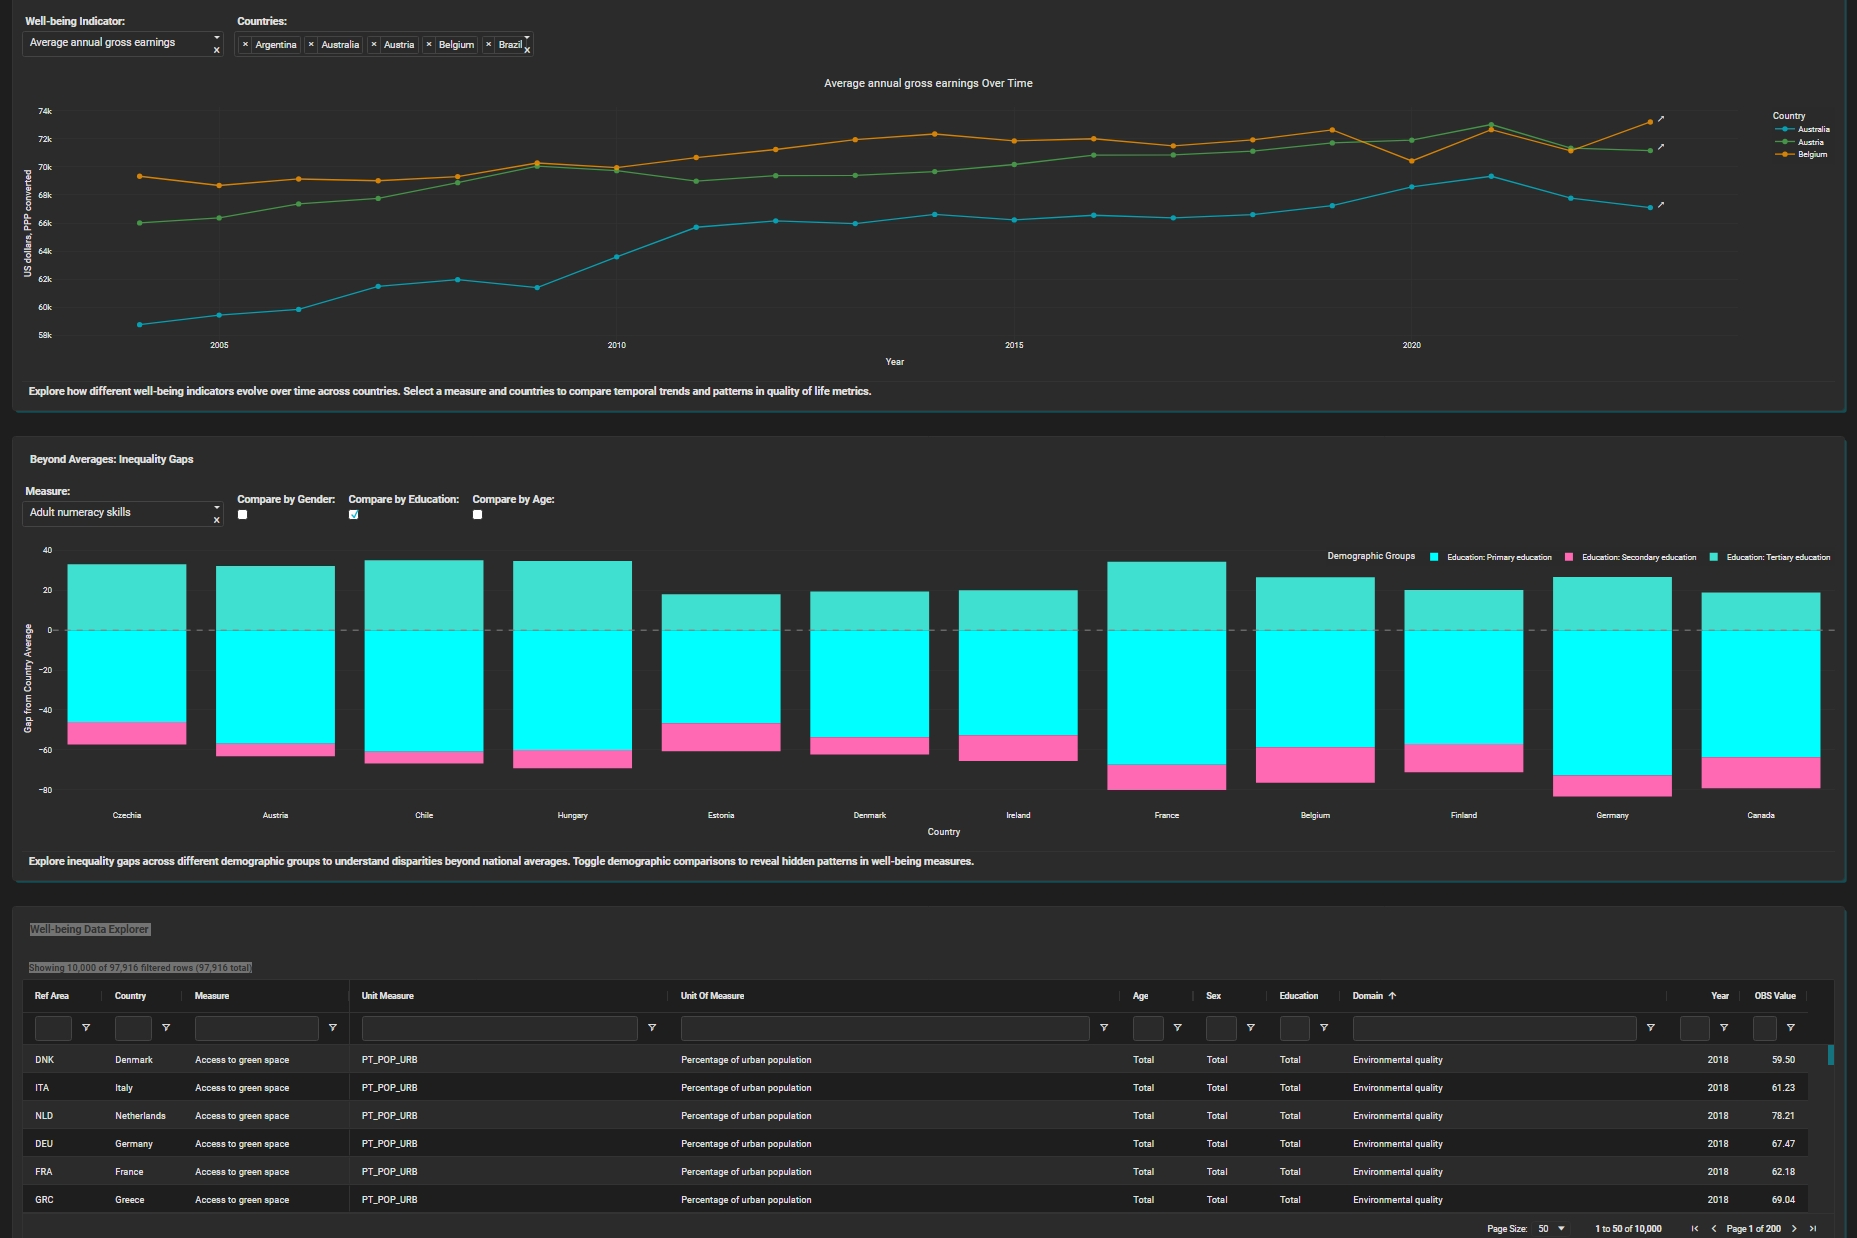
- Explore temporal trends in well-being over the last two decades
- Uncover inequalities by gender, age, and education
- Access a detailed data table for transparency
How we built it
I built the project using Plotly Studio, leveraging its ability to quickly and effectively transform datasets into rich interactive charts and dashboards. With cunstomised instruction I got the initial project structure which was ready to use, but for better visualization I had made saverall modifications on charts and cards.
Challenges we ran into
With nearly ~98k rows and many dimensions like age, education, year, sex, etc. to consider. Deciding which dimension to highlight without being overwhemed was tricky, along with balancing storytelling vs exploration and UI design in Plotly Studio.
Accomplishments that we're proud of
Turning a dense dataset of nearly ~98k rows of data into an accessible, interactive tool. Completing the project as a solo vibe-builder.
Built With
- plotly
- plotlystudio

Log in or sign up for Devpost to join the conversation.