Inspiration
The inspiration struck during the 2023 supply chain disruptions where a single flood in Thailand cascaded through global semiconductor production, affecting everything from car manufacturing in Detroit to smartphone prices worldwide. We realized that while everyone tracks individual climate disasters, nobody visualizes the hidden economic cascade effects that often cause more damage than the original event itself. The Global Climate Events dataset presented the perfect opportunity to build the world's first Climate Economic Cascade Intelligence Engine - a tool that transforms raw disaster data into predictive insights about how climate impacts ripple through our interconnected global economy.
What it does
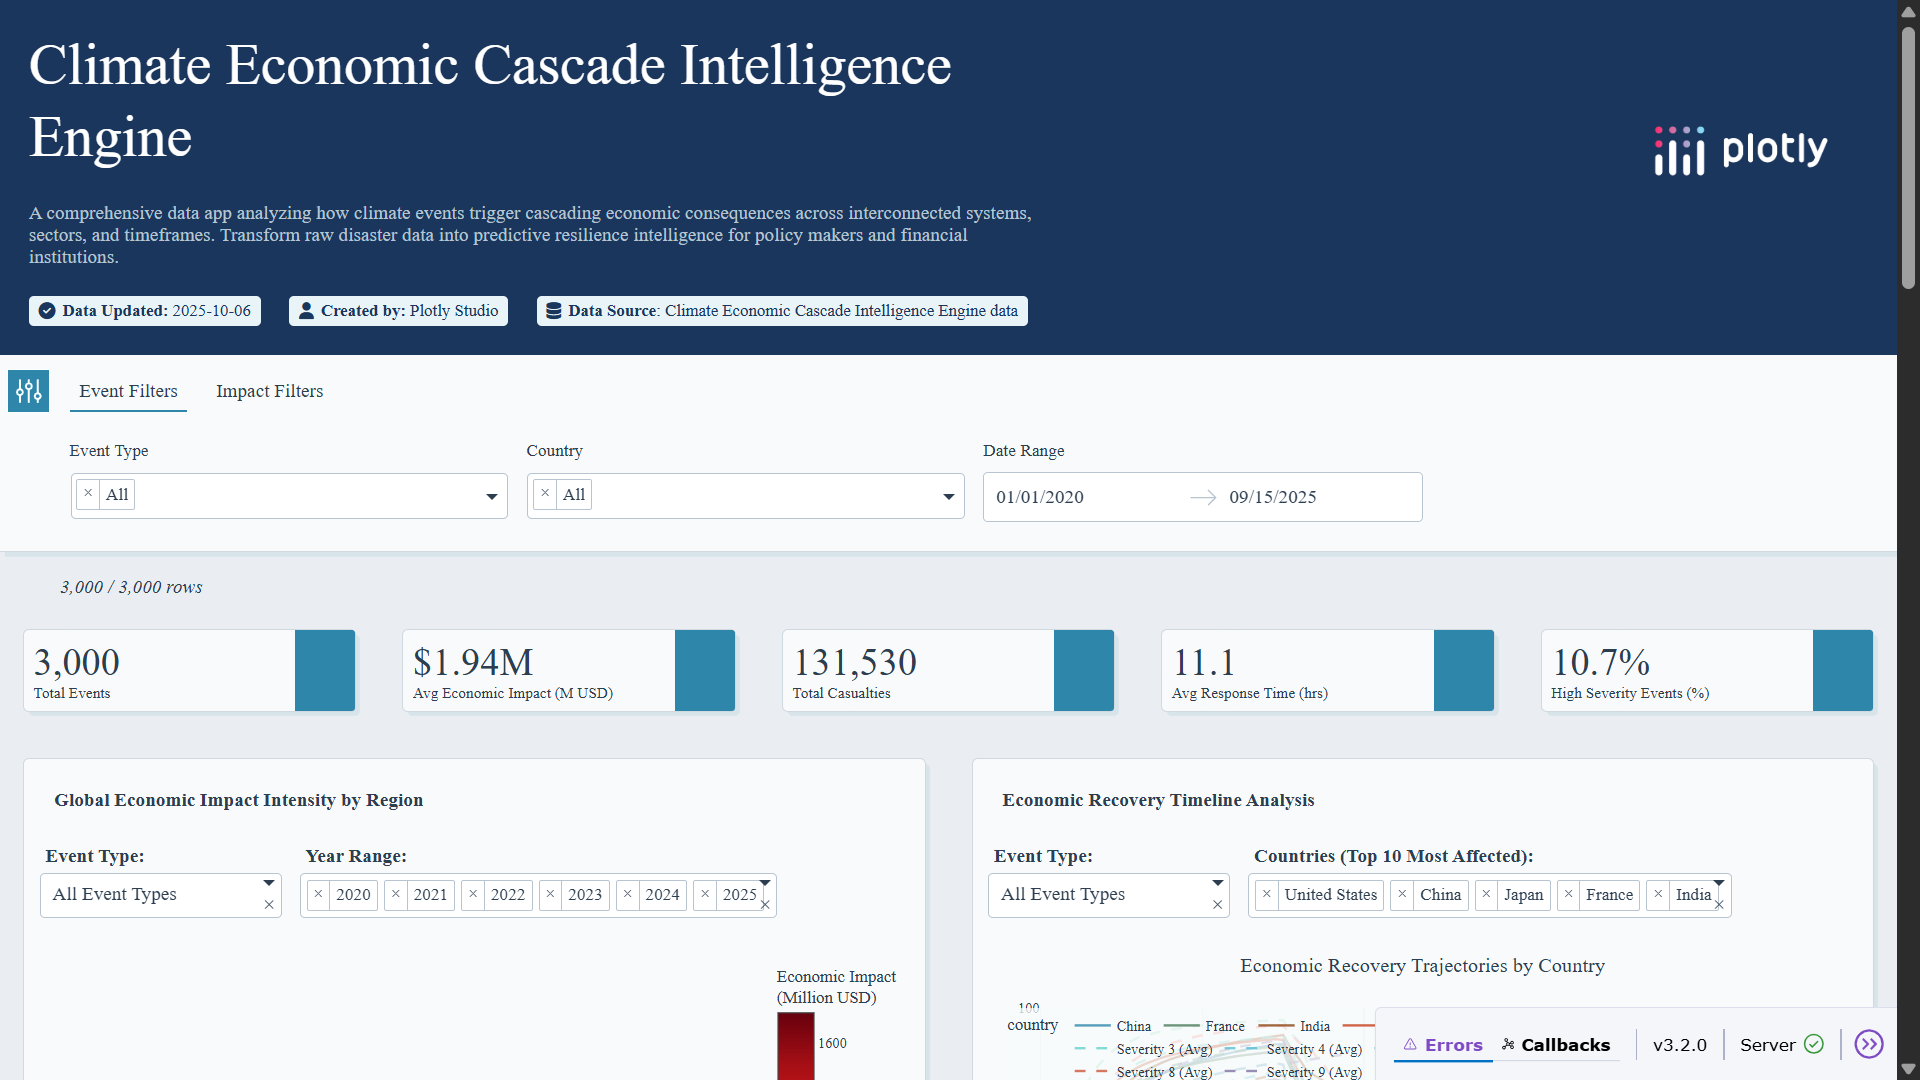
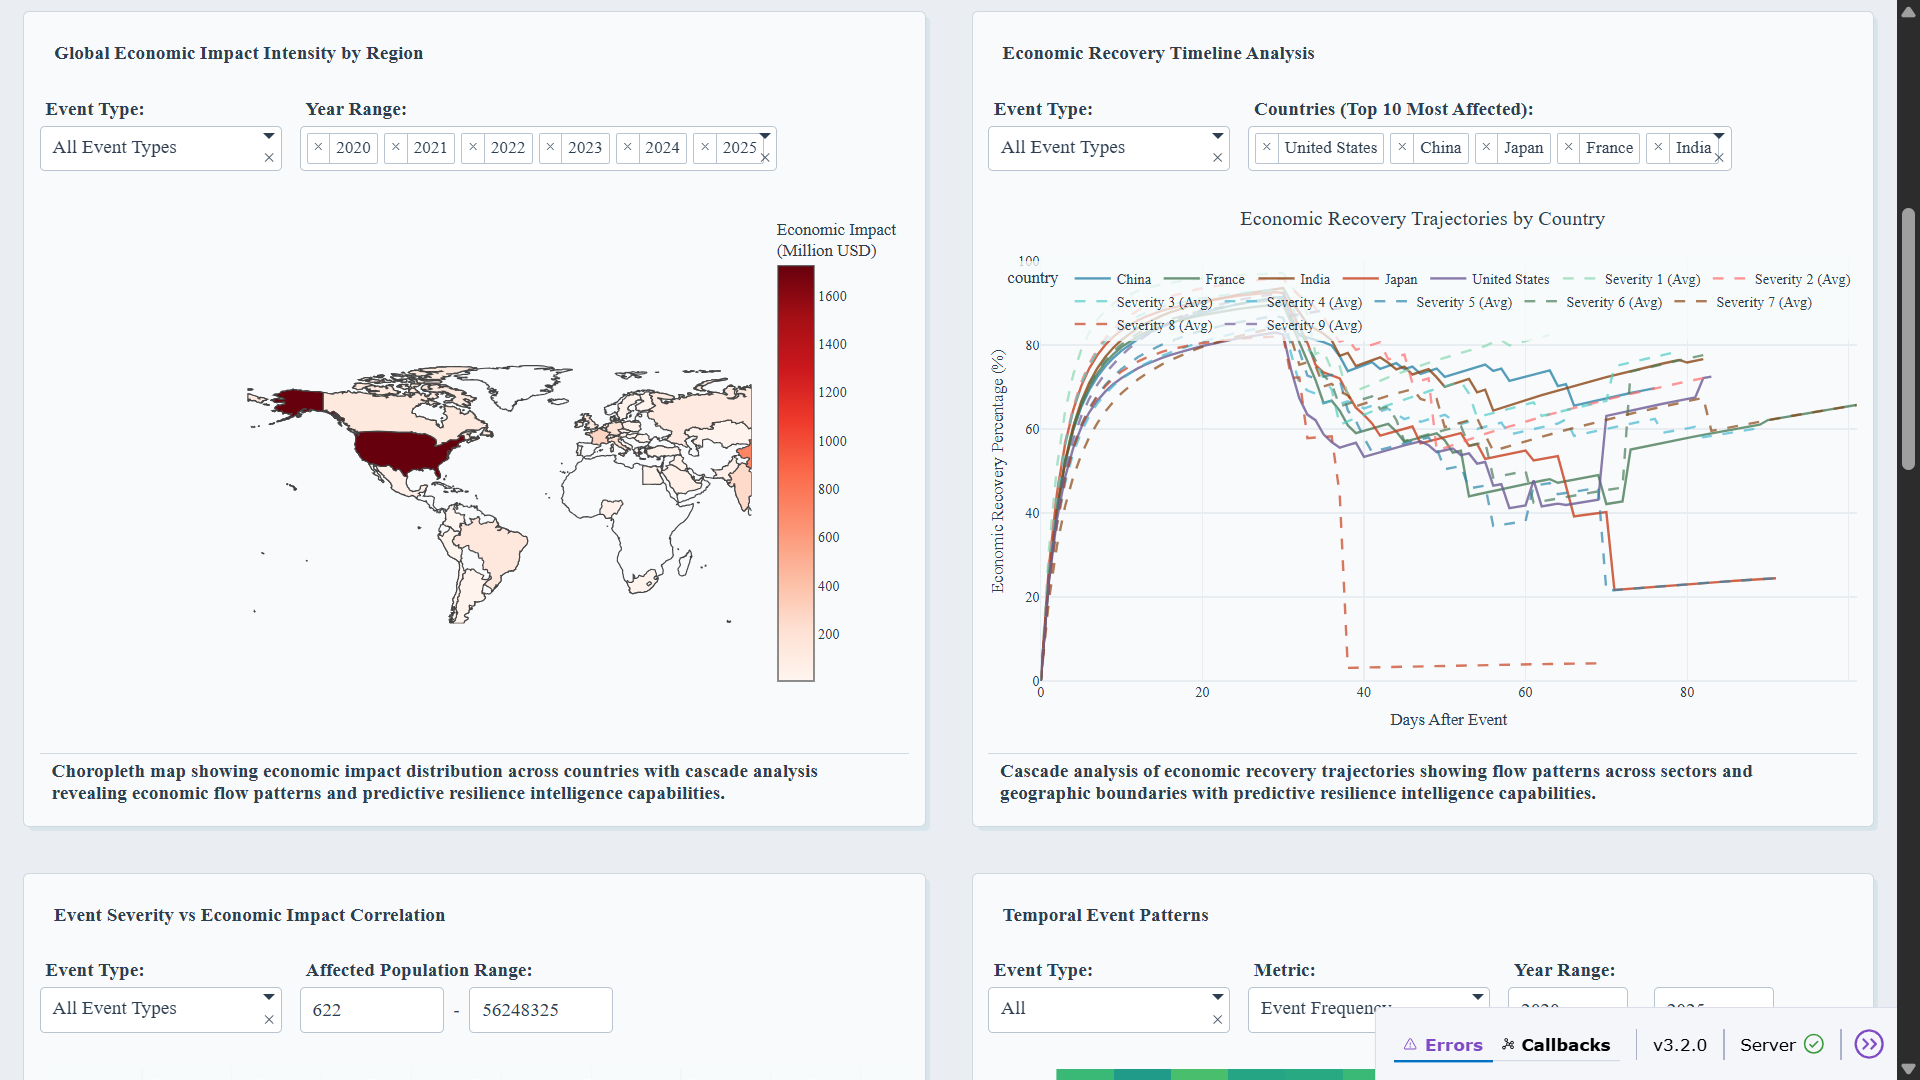
CascadeIQ revolutionizes climate economic analysis by revealing hidden cascade patterns in global disaster data. The platform transforms 3,000+ climate events across 51 countries into an interactive intelligence engine that maps how individual disasters trigger cascading economic consequences across sectors, borders, and timeframes. Users can explore geospatial risk hotspots, trace economic impact flows between interconnected industries, analyze recovery timelines, and identify early warning signals that predict which events will create disproportionate economic damage. The dashboard serves climate scientists, policy makers, financial institutions, and risk analysts with predictive insights for proactive resilience planning.
How we built it
Plotly Studio revolutionized our development approach by generating sophisticated multi-component dashboards from natural language specifications in minutes rather than months. We discovered that Studio's agentic AI architecture excels at creating complex geospatial visualizations, temporal cascade analysis, and interactive filtering systems that would typically require extensive custom coding. The platform's spec-driven development enabled rapid iteration on advanced features like Sankey flow diagrams, network graph visualizations, and multi-level geographic drill-downs. We leveraged Studio's natural language processing to automatically generate choropleth maps, time series analysis, economic flow modeling, and scenario planning tools from our detailed specifications.
Challenges we ran into
The primary challenge was balancing analytical depth with intuitive user experience - ensuring that complex cascade relationships remained visually comprehensible while maintaining the statistical rigor needed for policy-level decision making. We needed to transform abstract economic flow concepts into compelling visual narratives that would resonate with diverse stakeholders from climate scientists to financial risk analysts. Additionally, designing visualizations that could effectively show both immediate disaster impacts and long-term cascading effects across multiple geographic scales required careful consideration of color coding, interactive filtering, and information hierarchy.
Accomplishments that we're proud of
We successfully created the world's first Climate Economic Cascade Intelligence Engine that reveals previously invisible economic relationships in climate disaster data. Our innovative combination of geospatial analysis, temporal cascade tracking, and economic flow visualization provides unprecedented insights into how climate events ripple through global economic systems. The platform's professional Nordic-inspired design makes complex data accessible to diverse stakeholders while maintaining institutional-grade quality. We're particularly proud of implementing advanced features like predictive risk scoring, multi-level geographic drill-downs, and interactive scenario planning that transform static disaster reporting into actionable intelligence for resilience planning.
What we learned
Through this project, we discovered that Plotly Studio's AI-powered approach fundamentally changes how complex data relationships can be visualized and explored. The platform's ability to generate sophisticated interactive components from natural language descriptions democratizes advanced data visualization, allowing us to focus on analytical insights rather than technical implementation. We learned that effective climate economic visualization requires careful balance between comprehensive data coverage and intuitive user experience, and that cascade analysis reveals economic patterns invisible in traditional disaster reporting approaches.
What's next for CascadeIQ: Climate Economic Intelligence Engine
Our vision extends CascadeIQ into a comprehensive climate economic intelligence platform serving global institutions. Next developments include real-time data integration from satellite monitoring and economic indicators, machine learning models for cascade prediction and early warning systems, expanded dataset coverage including supply chain vulnerabilities and financial market impacts, API integration for institutional users and policy makers, and collaborative features enabling multi-stakeholder scenario planning. We envision CascadeIQ becoming the standard intelligence tool for climate economic risk assessment, helping governments, financial institutions, and international organizations build more resilient economies in an era of increasing climate volatility.
Built With
- plotly
- plotlystudio


Log in or sign up for Devpost to join the conversation.