Inspiration
The growing disparities in wages, employment opportunities, and cost of living across regions and demographics inspired this project. With remote work reshaping the global labor landscape, we wanted to build a tool that offers clear, data-driven insights into how these factors interact and evolve.
What it does
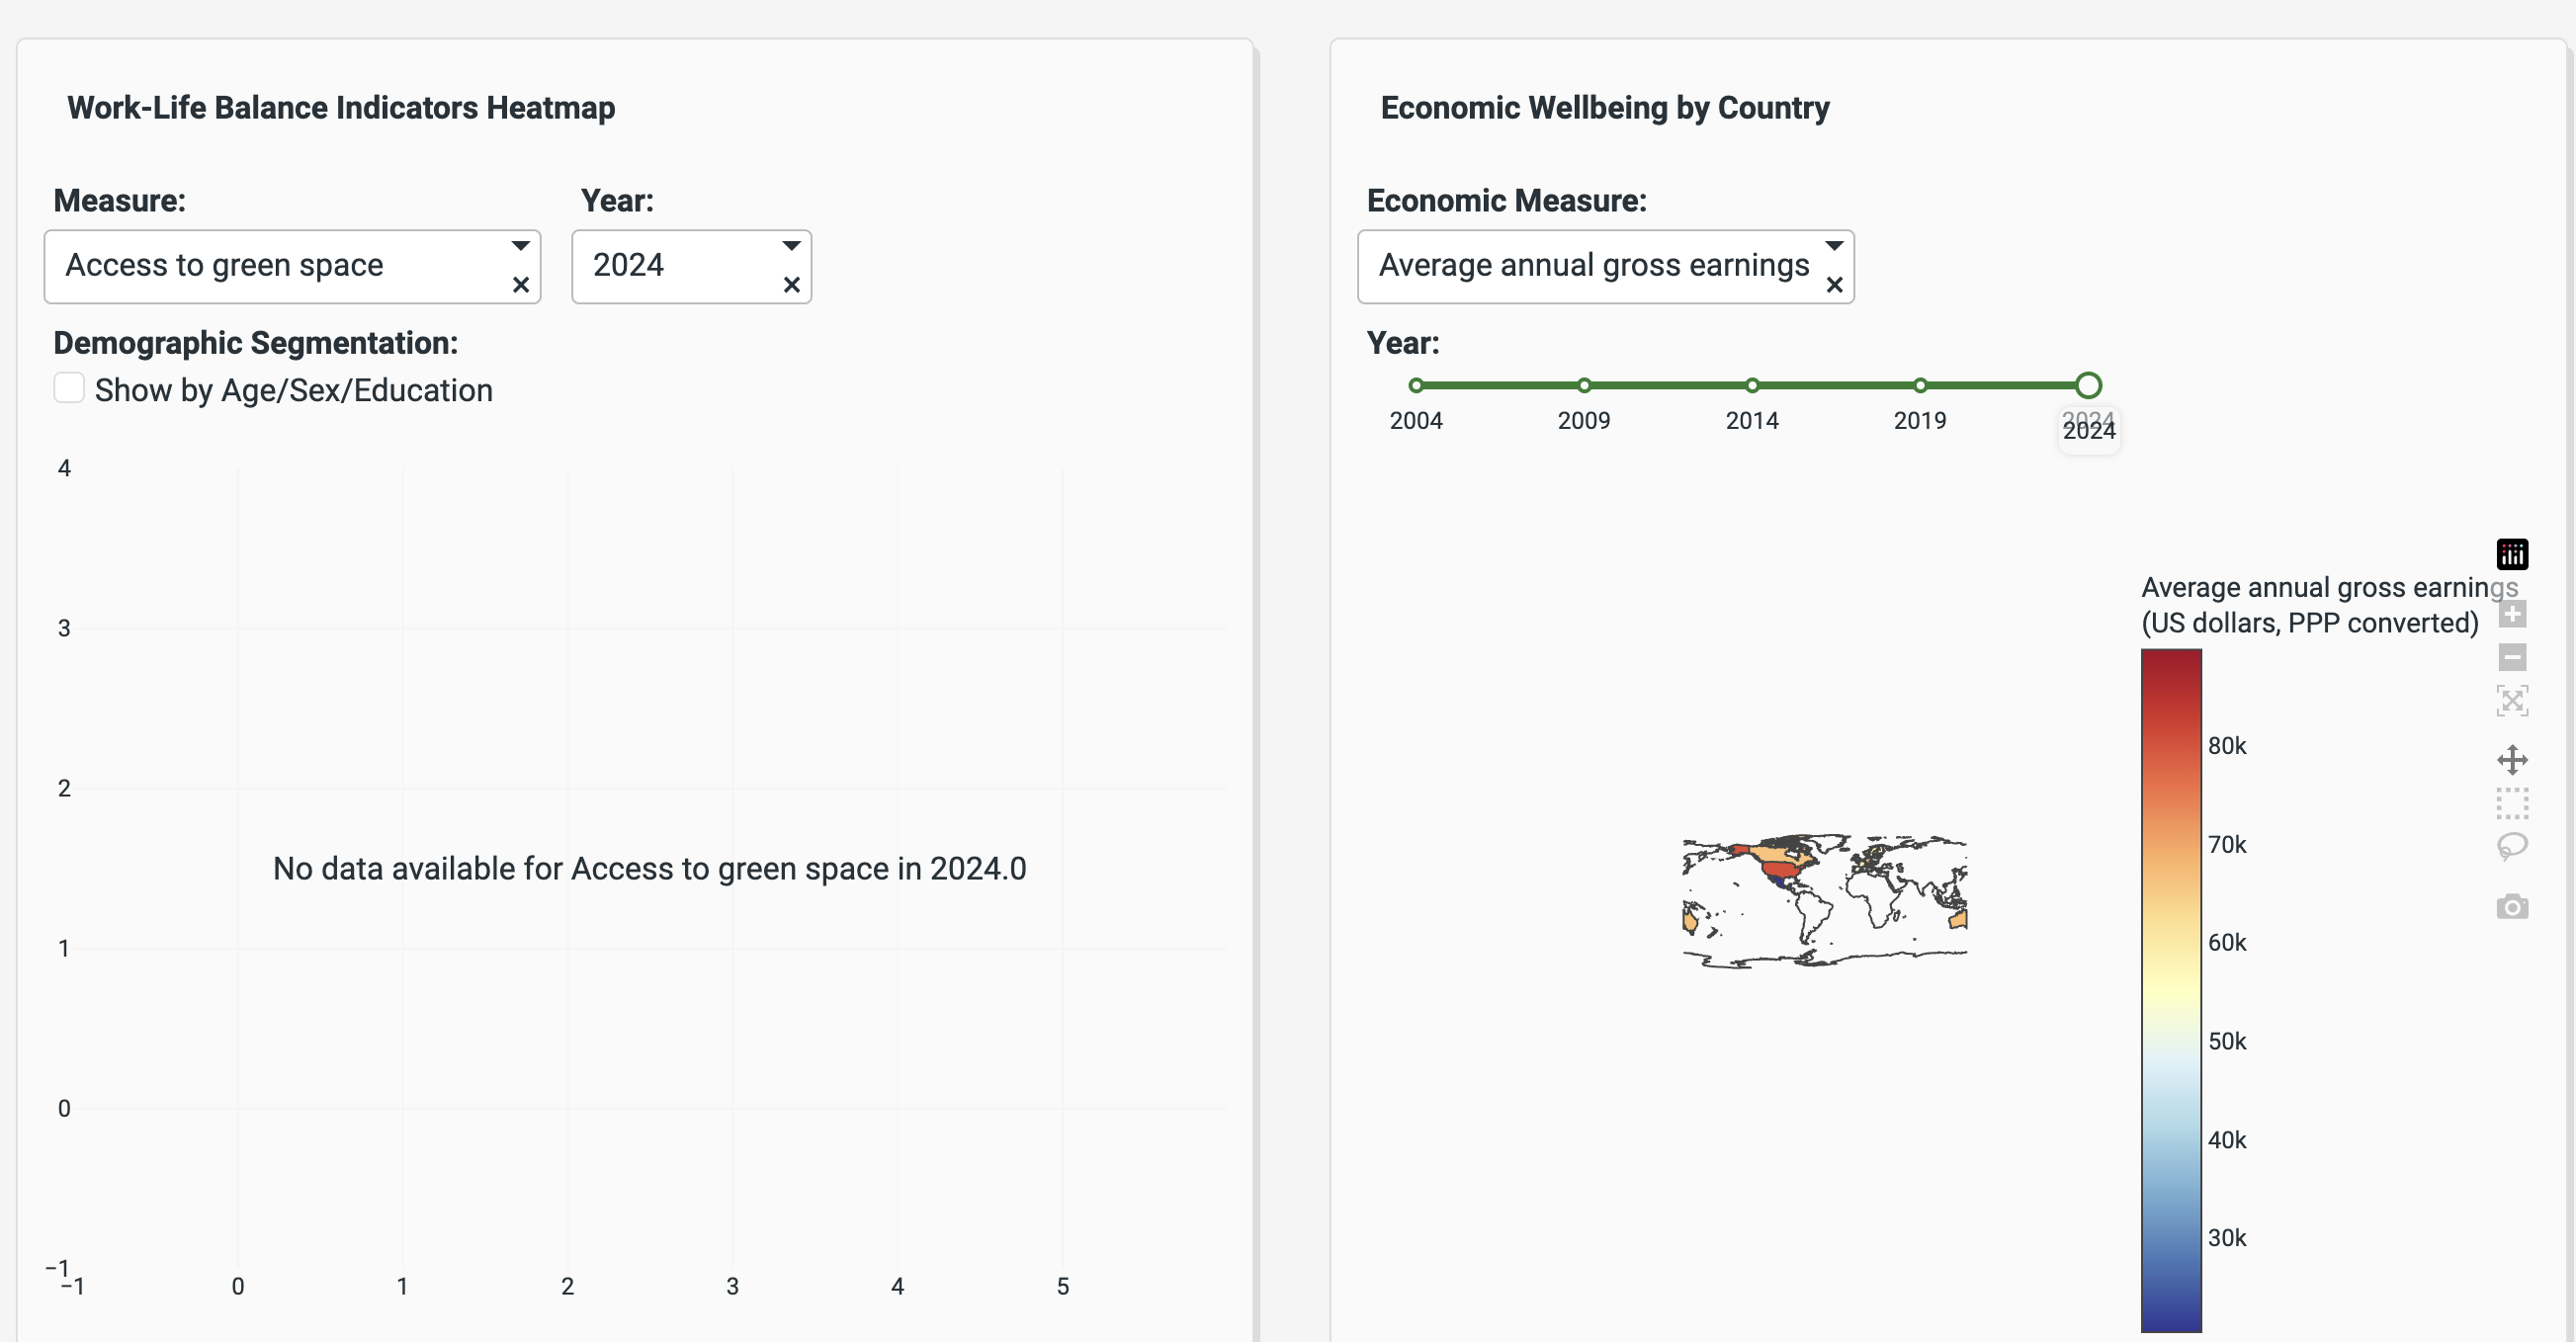
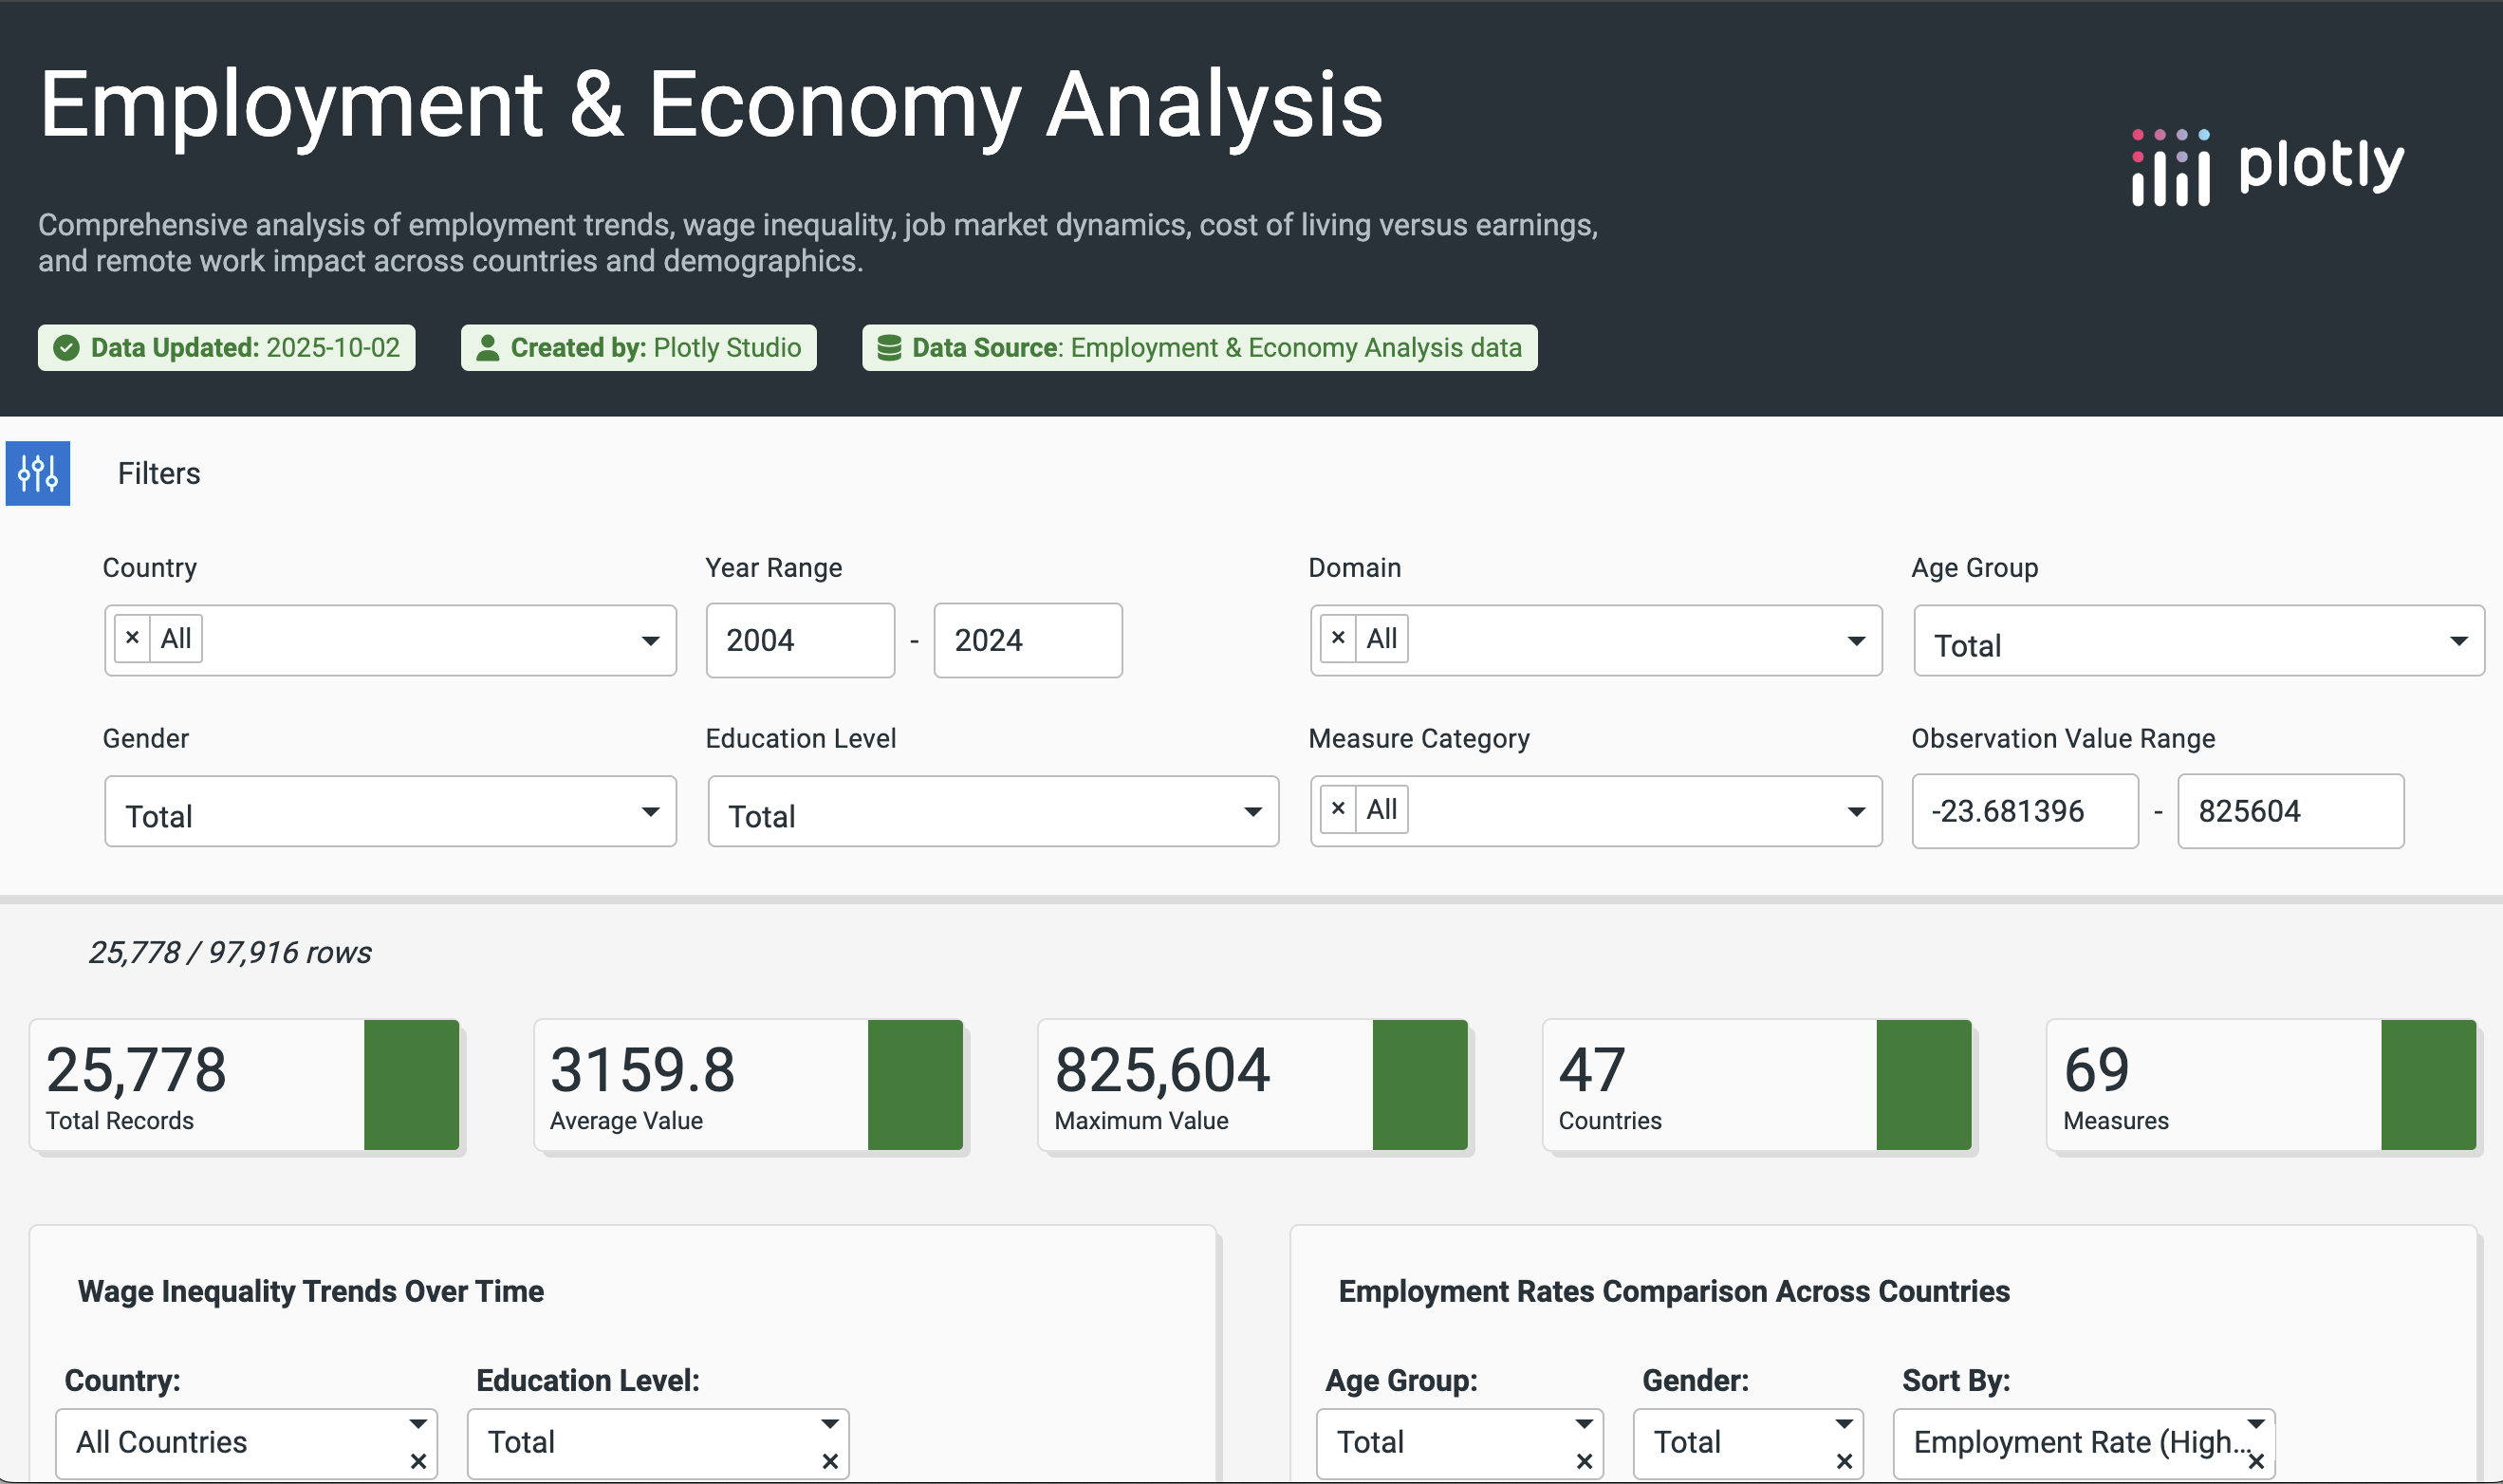
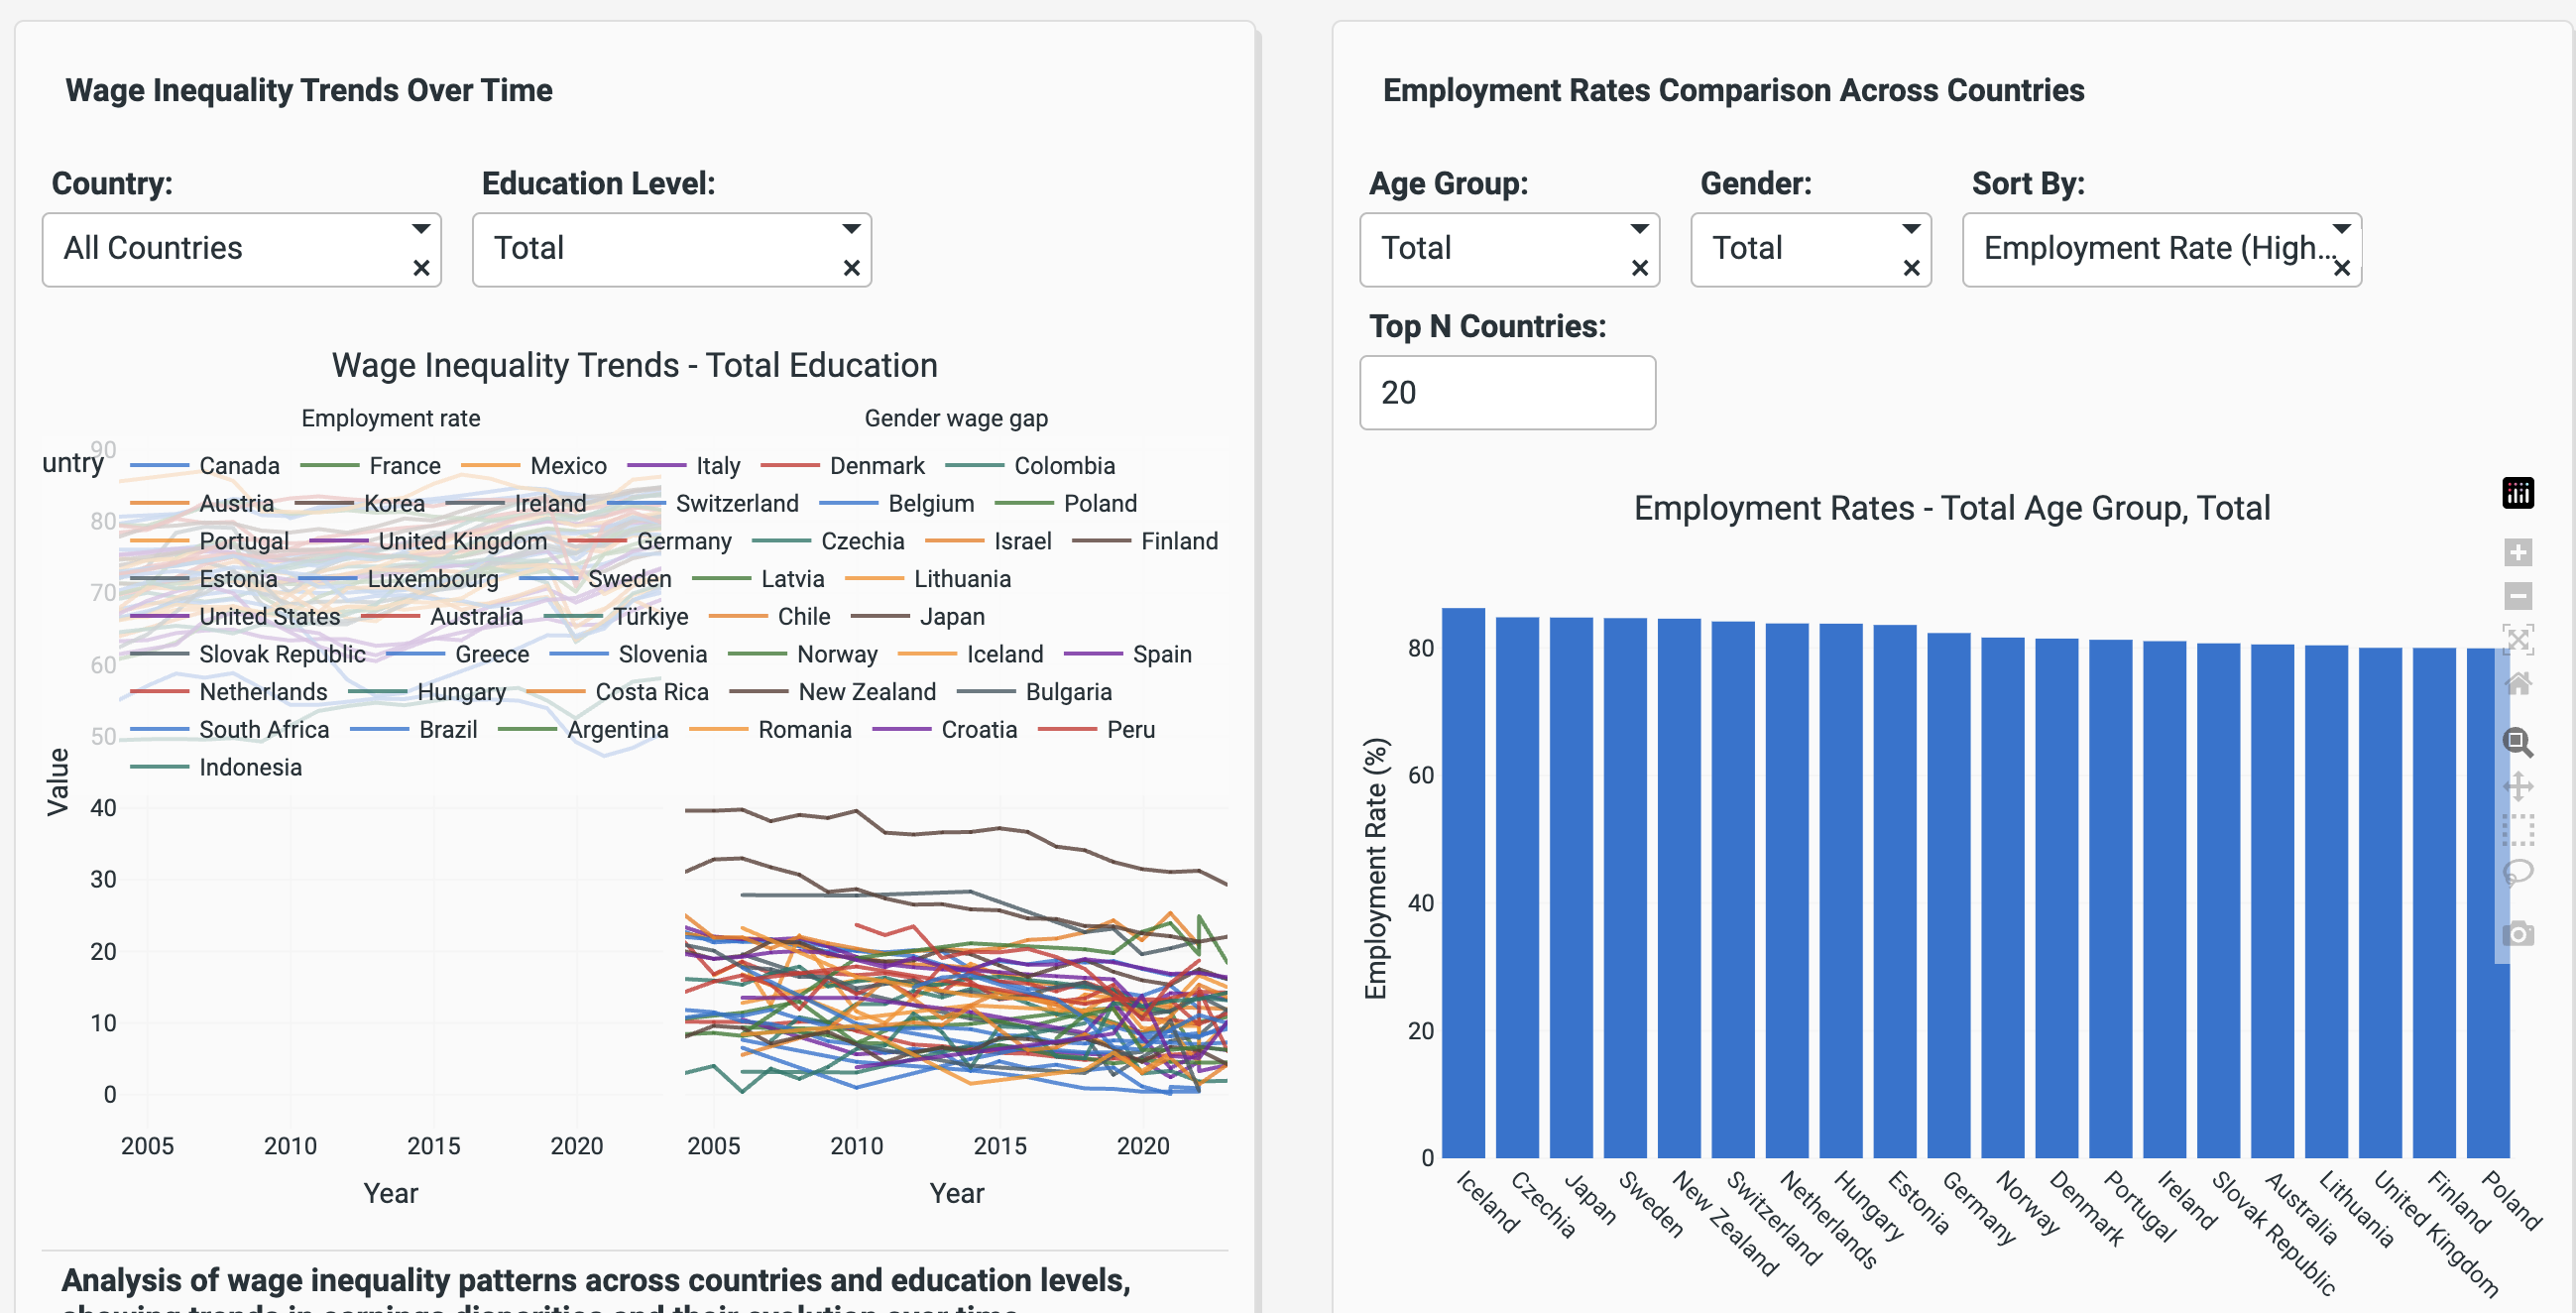
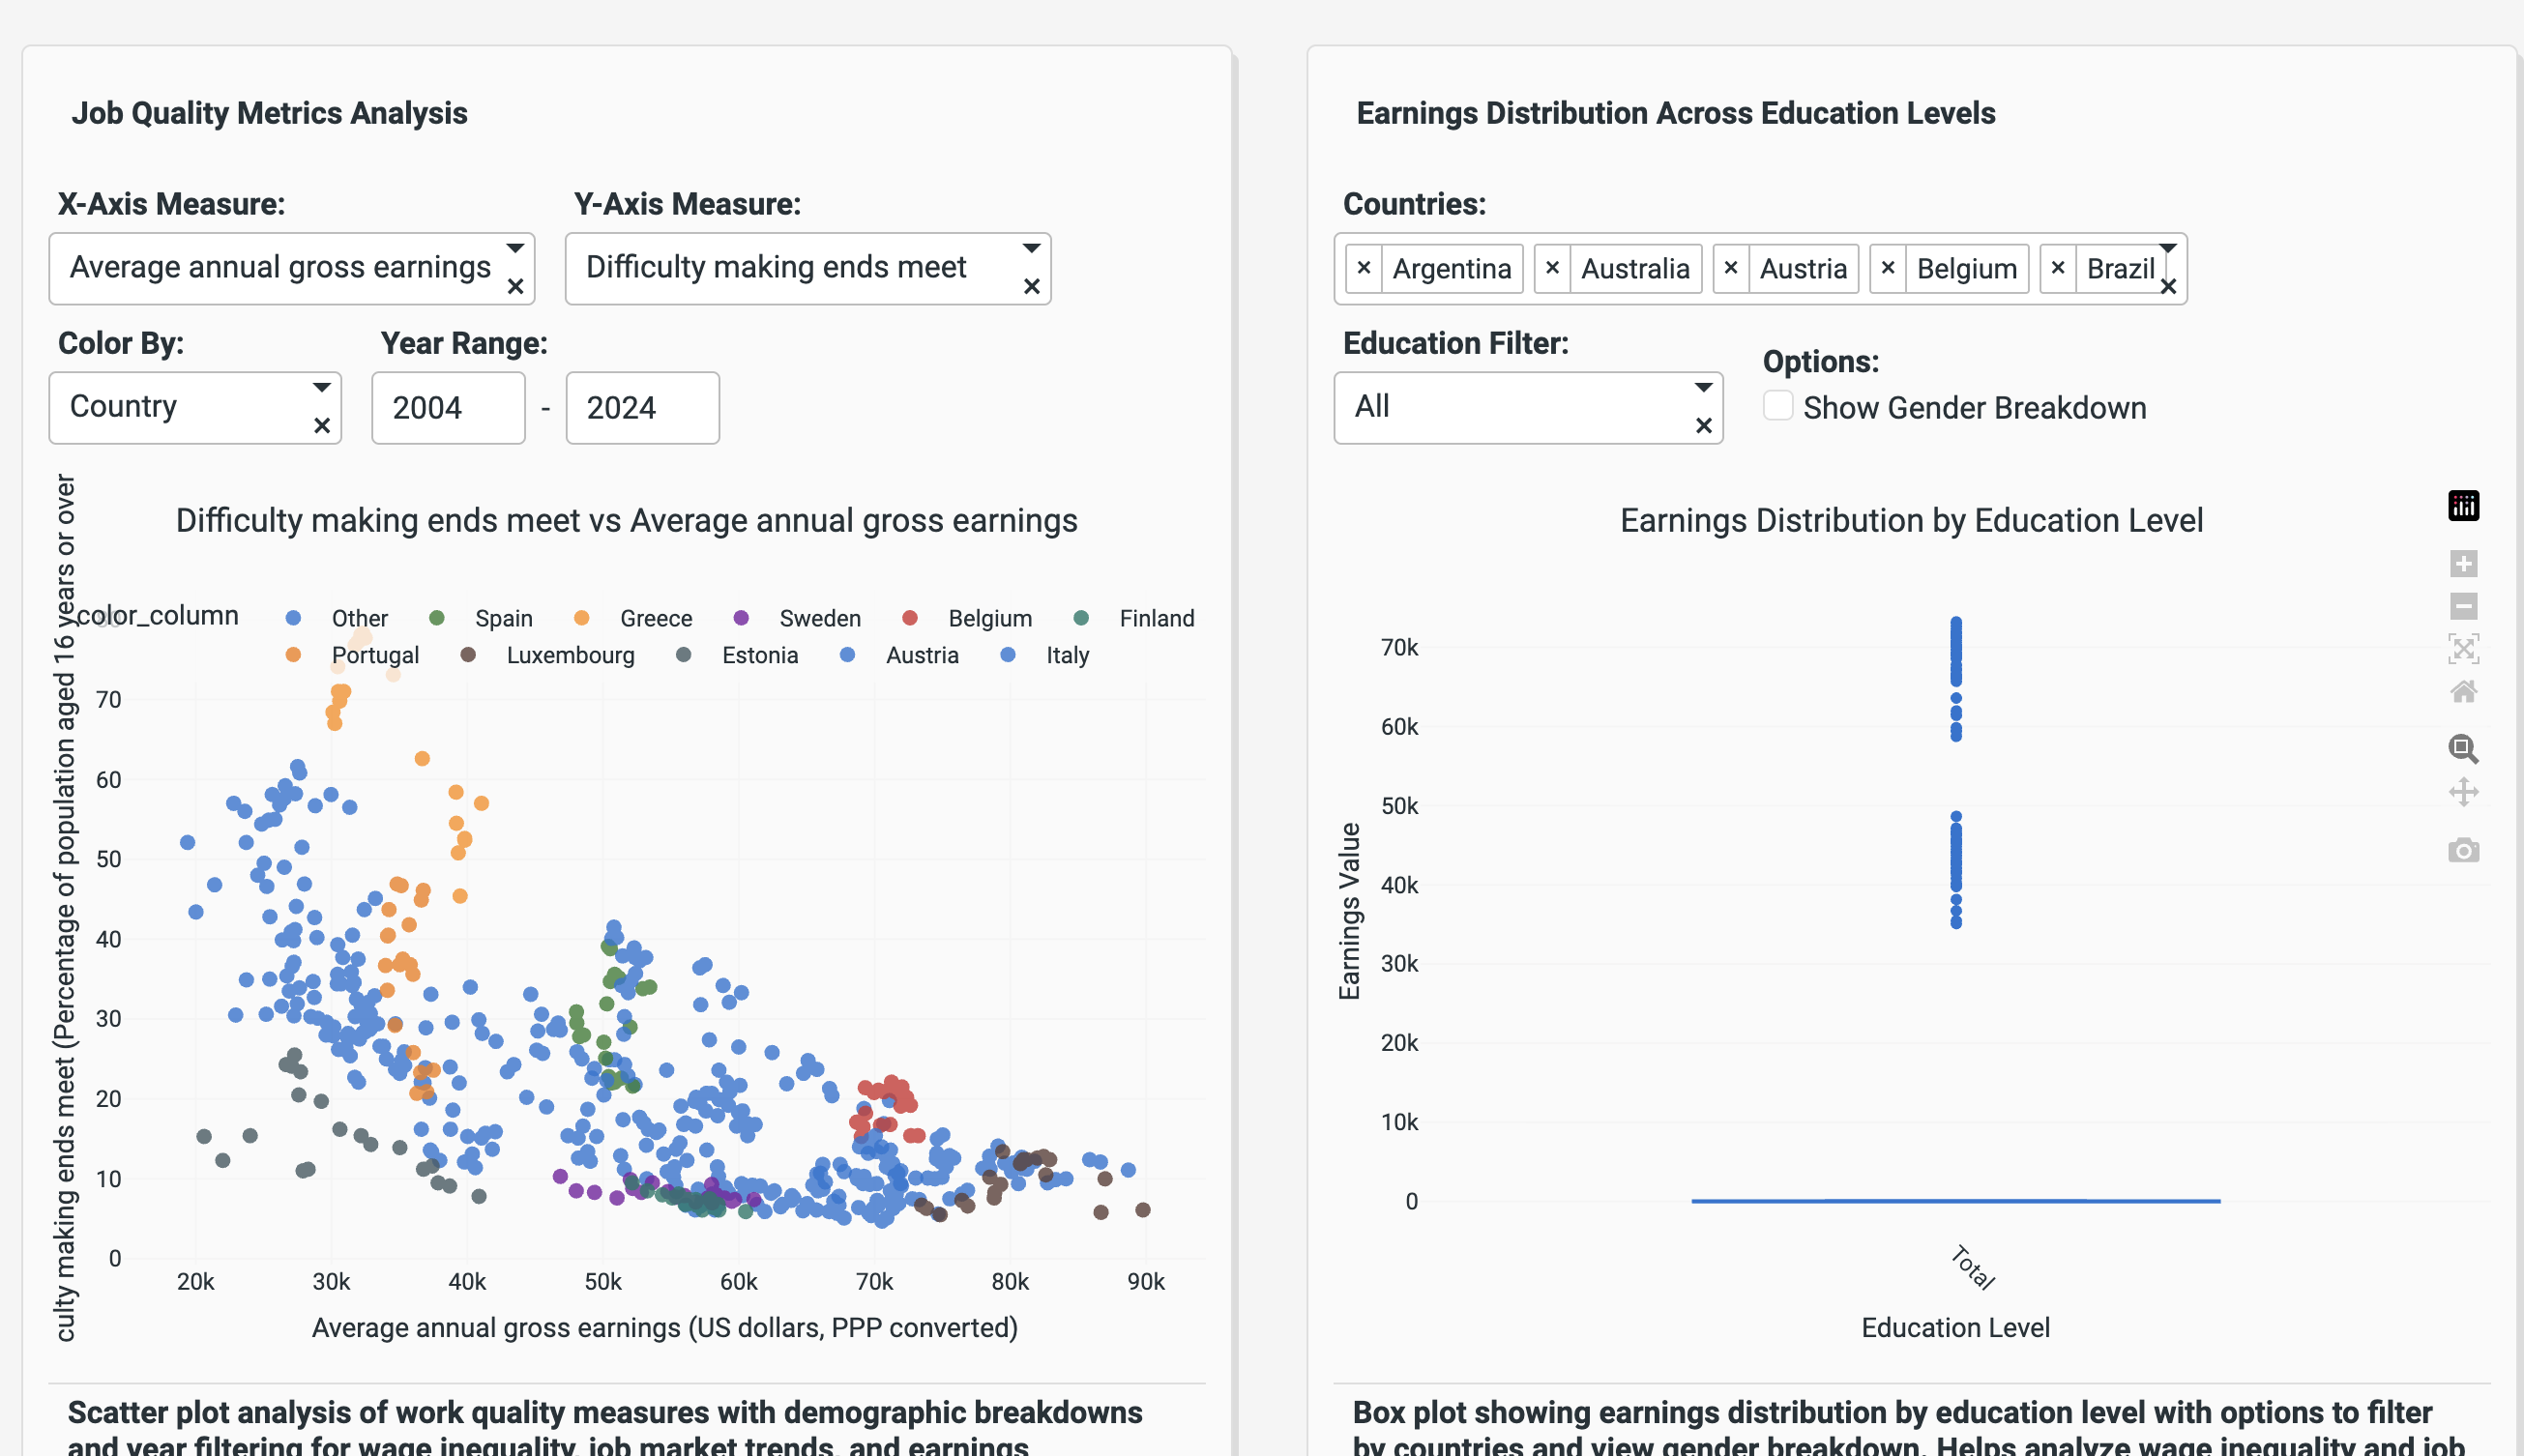
Employment & Equity Monitor analyzes employment trends, wage inequality, job market dynamics, and the cost of living versus earnings across countries and demographics. It visualizes disparities, tracks remote work adoption, and helps policymakers, researchers, and businesses make informed decisions.
How we built it
We combined publicly available datasets from sources like the ILO, World Bank, OECD, and national statistics bureaus. Using Python and data visualization libraries (e.g., Plotly, Matplotlib), we built interactive dashboards and comparative charts. The backend processes data cleaning, normalization, and statistical analysis, while the frontend presents insights in a user-friendly format.
Challenges we ran into
- Data inconsistency across countries and time periods
- Limited access to granular demographic data in some regions
- Balancing complexity and clarity in visualizations -Remote work metrics were often fragmented or anecdotal
What we learned
- The importance of contextualizing data—numbers alone don’t tell the full story
- How remote work is both a solution and a challenge for equity
- That wage inequality is deeply tied to policy, education, and access
- The value of clean, well-documented datasets for meaningful analysis
Built With
- plotly
- plotly-studio

Log in or sign up for Devpost to join the conversation.