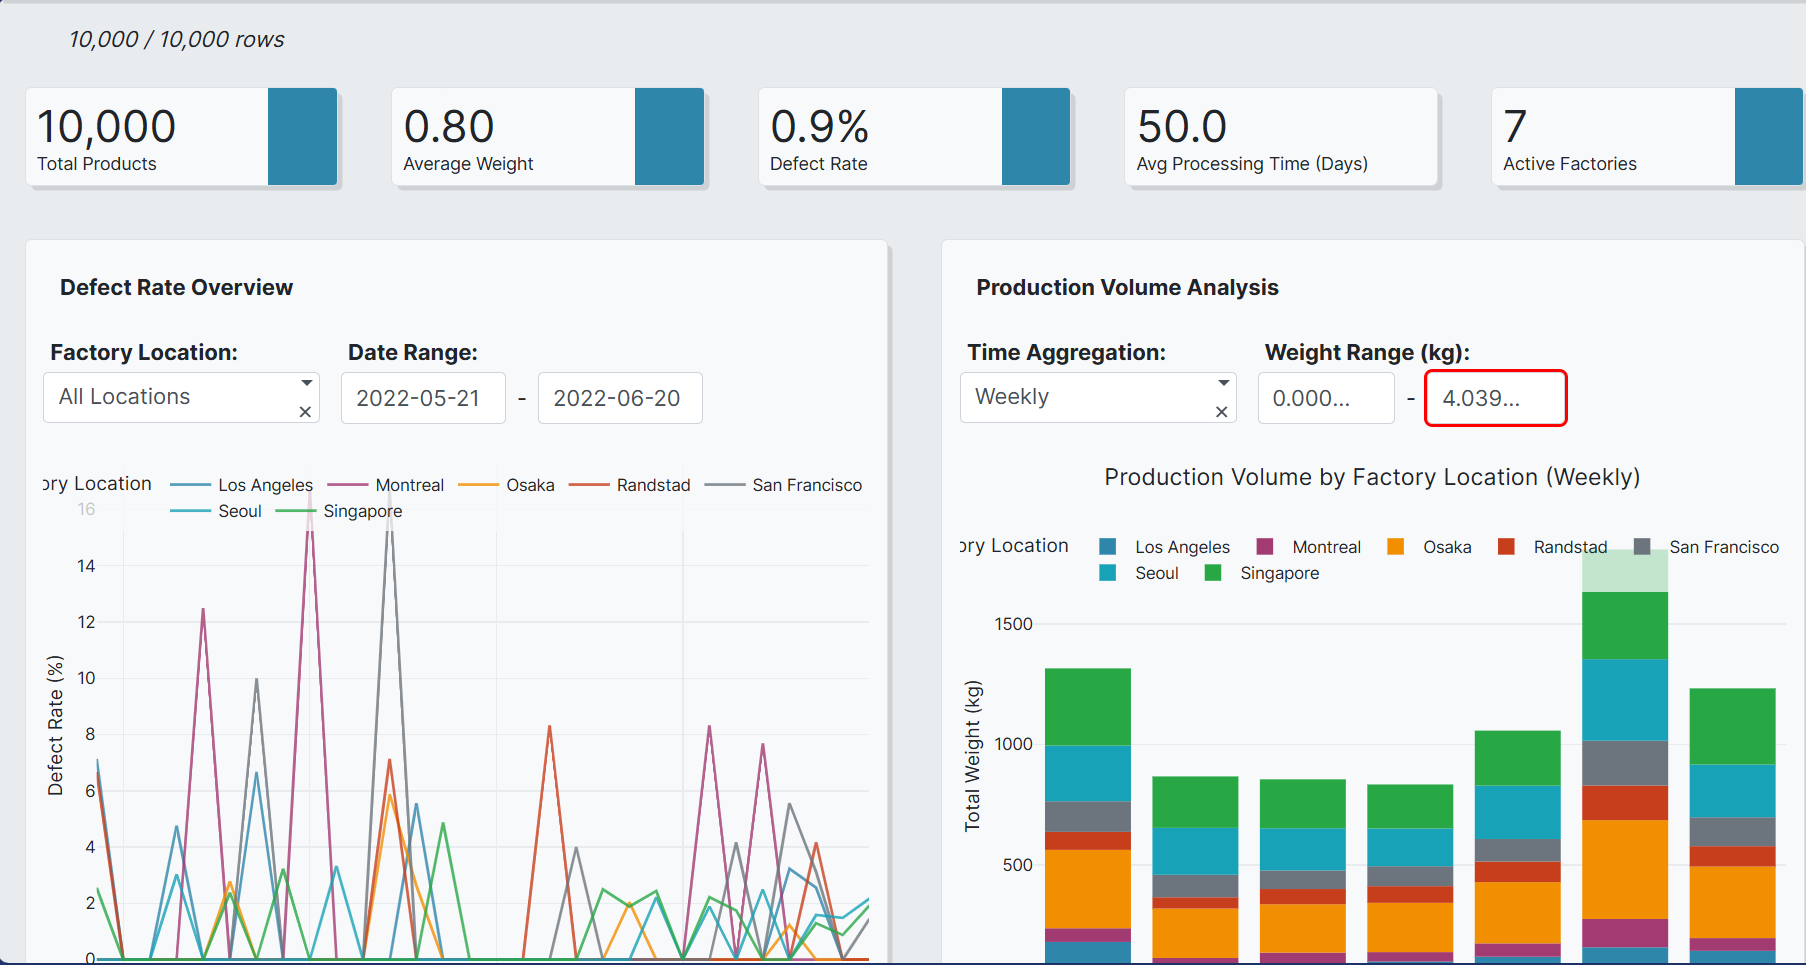
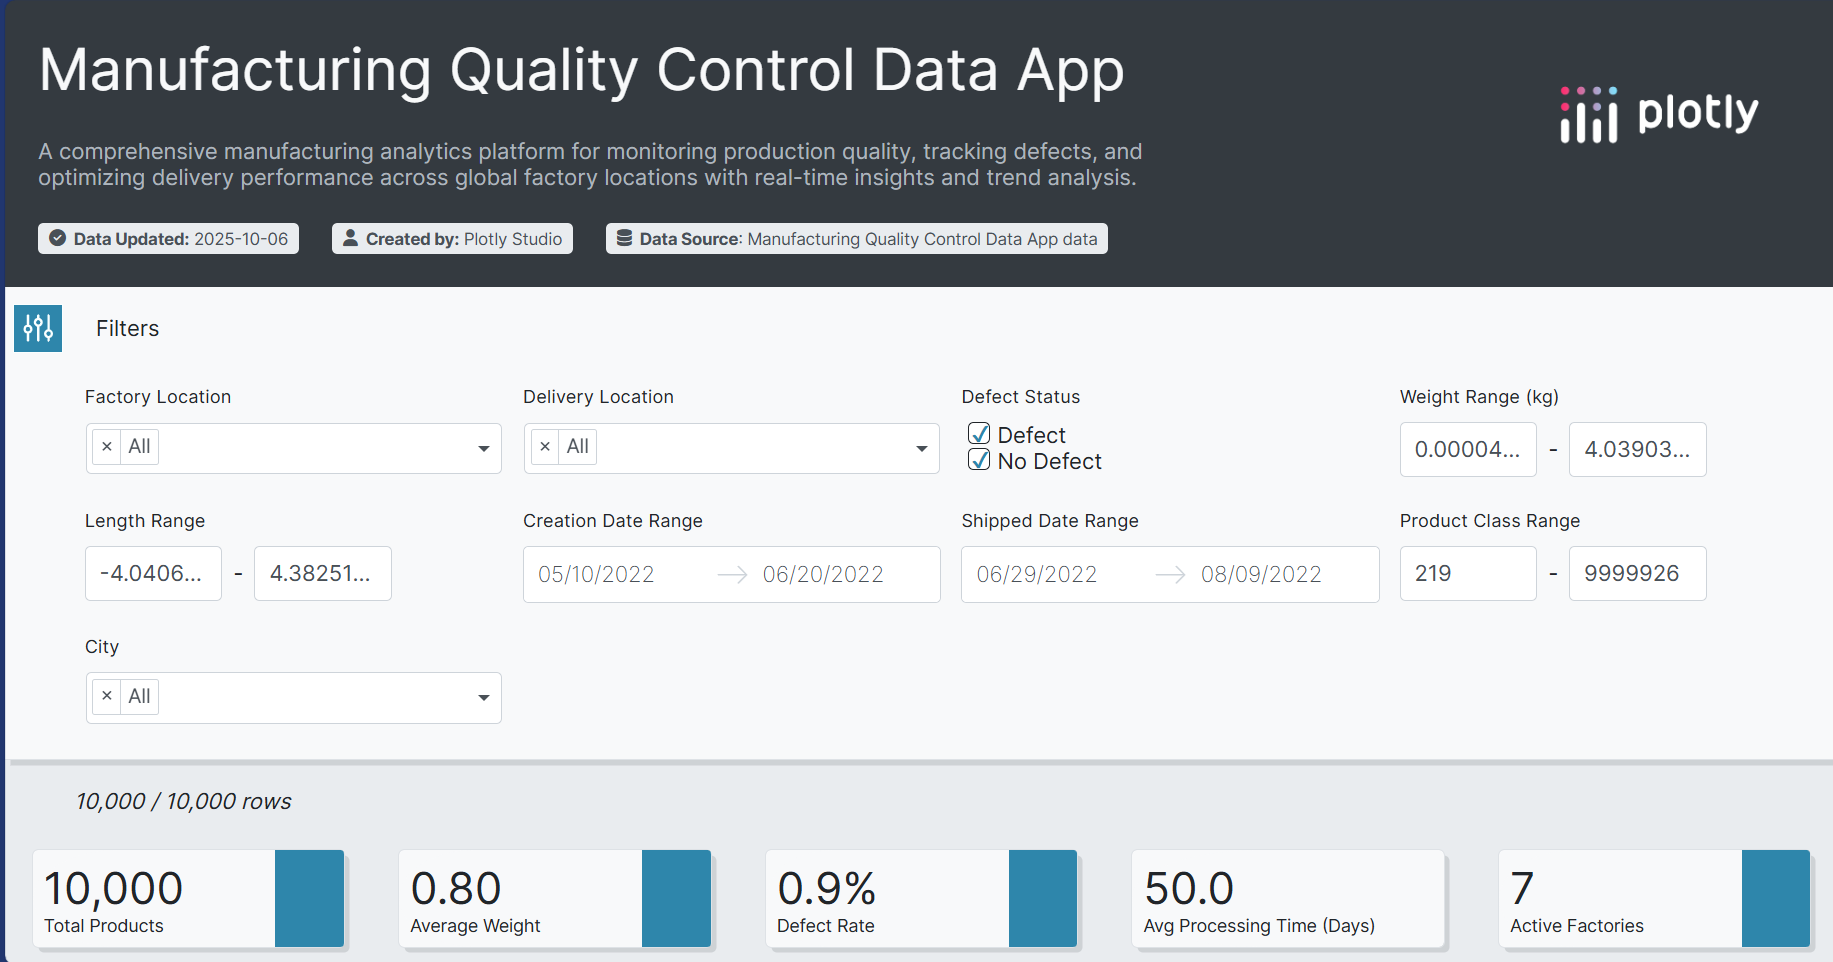
What Inspired Me The inspiration for Sentinel grew directly out of my previous project, a manufacturing quality control dashboard. While building that app, I realized I was primarily focused on descriptive analytics—analyzing defects that had already occurred. A question kept coming to mind: "What if we could catch the problem before the defect is even created?"
This led me down the rabbit hole of industrial IoT and the immense cost of unexpected equipment failure. A single line stoppage can cost a company thousands of dollars per minute. I realized that the real value wasn't just in seeing what went wrong, but in using data to see what's about to go wrong. As a Computer Science Engineering student, the challenge of merging real-time data streams, machine learning, and a practical user interface to solve such a high-impact problem was an inspiration I couldn't ignore.
How I Built It Building Sentinel was a multi-stage process that moved from data exploration to model deployment.
Research and Data Sourcing: I started by researching common predictive maintenance techniques and sourced a public dataset of turbofan engine degradation from NASA. This dataset was perfect as it contained multivariate time-series sensor data leading up to an eventual failure event.
Exploratory Data Analysis (EDA): Using pandas, matplotlib, and seaborn, I dove into the data. I visualized the sensor readings over the operational lifetime of several engines, which helped me identify which sensors showed clear degradation patterns as the engine approached failure.
Model Development & Training: This was the core of the project. I engineered features from the raw sensor data, such as rolling averages and standard deviations, to capture recent trends. I then experimented with two models:
A Random Forest Classifier using scikit-learn to establish a baseline performance.
A more complex Long Short-Term Memory (LSTM) Recurrent Neural Network using TensorFlow and Keras, which is well-suited for learning patterns in sequential data.
I evaluated the models not just on accuracy, but on Precision and Recall, as the "failure" class was rare. The goal was to maximize the F1-Score to find a balance between catching potential failures without creating too many false alarms.
$$ F_1 = 2 \cdot \frac{\text{Precision} \cdot \text{Recall}}{\text{Precision} + \text{Recall}} $$
Backend API & Frontend Dashboard: I saved the best-performing trained model and built a simple backend API with FastAPI. This API could receive new sensor data, process it, and return a failure prediction score. For the frontend, I used Plotly and Dash to create an interactive dashboard that simulates real-time data, visualizes sensor readings, and displays clear alerts when the model predicts an impending failure.
Challenges I Faced Imbalanced Data: By far the biggest challenge was the nature of the data itself. In any real-world scenario, machines operate normally over 99% of the time. Training a model on such an imbalanced dataset required techniques like adjusting class weights to force the model to pay more attention to the rare failure events.
Defining the Prediction Window: I had to answer a critical question: how far in advance should a prediction be made to be useful? Predicting a failure 10 seconds before it happens is useless. I experimented with labeling data to predict failures 10, 20, and 30 cycles in advance to find a useful and achievable prediction window.
Feature Engineering: Raw sensor data is noisy. The challenge was to transform it into meaningful features that the model could learn from. This involved a lot of trial and error with different window sizes for rolling averages and other statistical measures to find the signals that were truly predictive of failure.
What I Learned This project was a massive learning experience. I moved beyond theoretical knowledge into the practical application of machine learning for time-series data. I learned the importance of domain-specific feature engineering and that choosing the right evaluation metric (like the F1-Score) is often more important than the model algorithm itself. Building the end-to-end system, from data exploration and model training to deploying it via an API and visualizing the results on a live dashboard, gave me a holistic understanding of how a data science project comes to life in a real-world application.


Log in or sign up for Devpost to join the conversation.