-
-
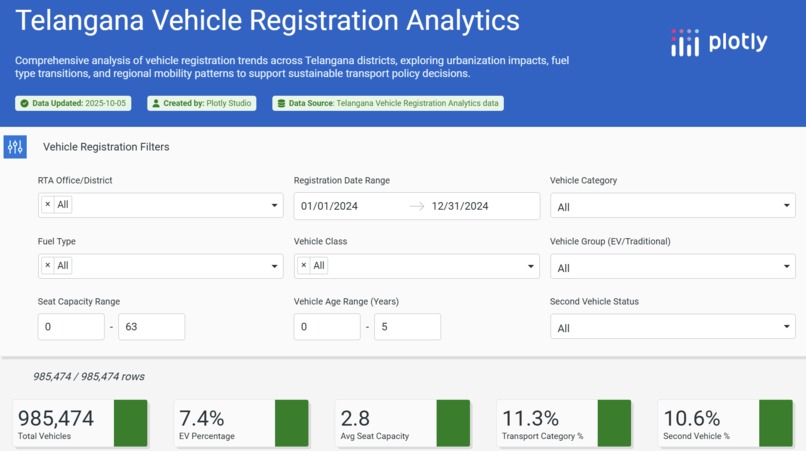
vehicle_dash

Inspiration
With India’s rapid urbanization, understanding vehicle growth patterns has become crucial for sustainable mobility planning. Telangana, being one of India’s fastest-growing states, shows a sharp rise in vehicle ownership, but there’s limited data visibility for policymakers and citizens. This inspired me to build an interactive data visualization dashboard that reveals trends, patterns, and insights from the state’s vehicle registration data.
What it does
The dashboard visualizes vehicle registration data across Telangana districts. It allows users to explore trends by vehicle type, fuel type, and registration year. Key features include:
District-wise comparison of vehicle registrations
Insights into electric vehicle adoption rates
Growth analysis by year and vehicle class
Interactive visual filters for dynamic exploration
How we built it
Tools used: Plotly, Dash, Python (Pandas, NumPy), and Plotly Studio for visualization.
Data source: Telangana Open Data Portal – Vehicle Registration dataset.
Cleaned and processed the data using Python (Pandas) to handle missing values, format columns, and derive new metrics like YoY growth.
Designed interactive visualizations in Plotly (bar charts, heatmaps, line plots) to highlight trends.
Deployed the dashboard on GitHub for public access and transparency.
Challenges we ran into
Handling large and inconsistent datasets from government sources.
Normalizing categorical data such as vehicle class and fuel type for accurate filtering.
Designing visuals that are both informative and user-friendly.
Integrating interactivity without compromising dashboard speed.
Accomplishments that we're proud of
Successfully created a clean, intuitive dashboard that brings clarity to a large dataset.
Identified regional trends and the rise of electric vehicles in Telangana.
Delivered a project that connects data analytics with real-world transport planning.
What we learned
How to handle open government datasets efficiently.
Data visualization best practices using Plotly.
Importance of storytelling in analytics projects by transforming raw data into actionable insights.
Enhanced understanding of urban transport data patterns in India.
What's next for Vehicle Registrations
Incorporate predictive analytics to forecast vehicle growth.
Add geospatial mapping to visualize district-level density on maps.
Expand dataset coverage to include emission levels and road infrastructure data.
Publish insights for policymakers and researchers working on sustainable mobility in India.

Log in or sign up for Devpost to join the conversation.