-
-
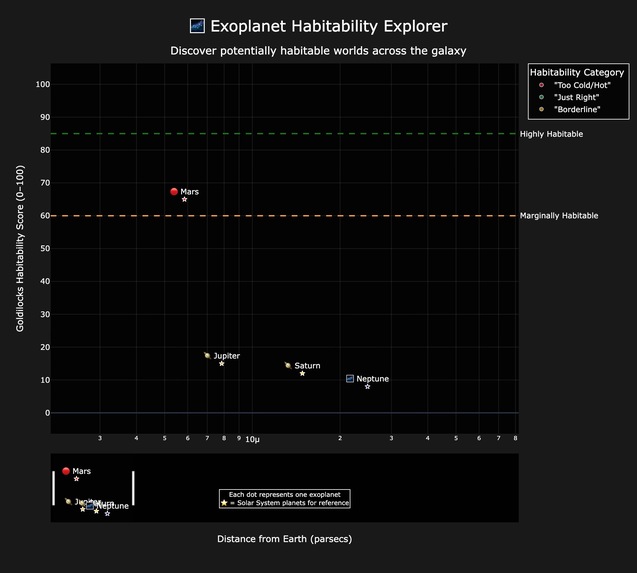
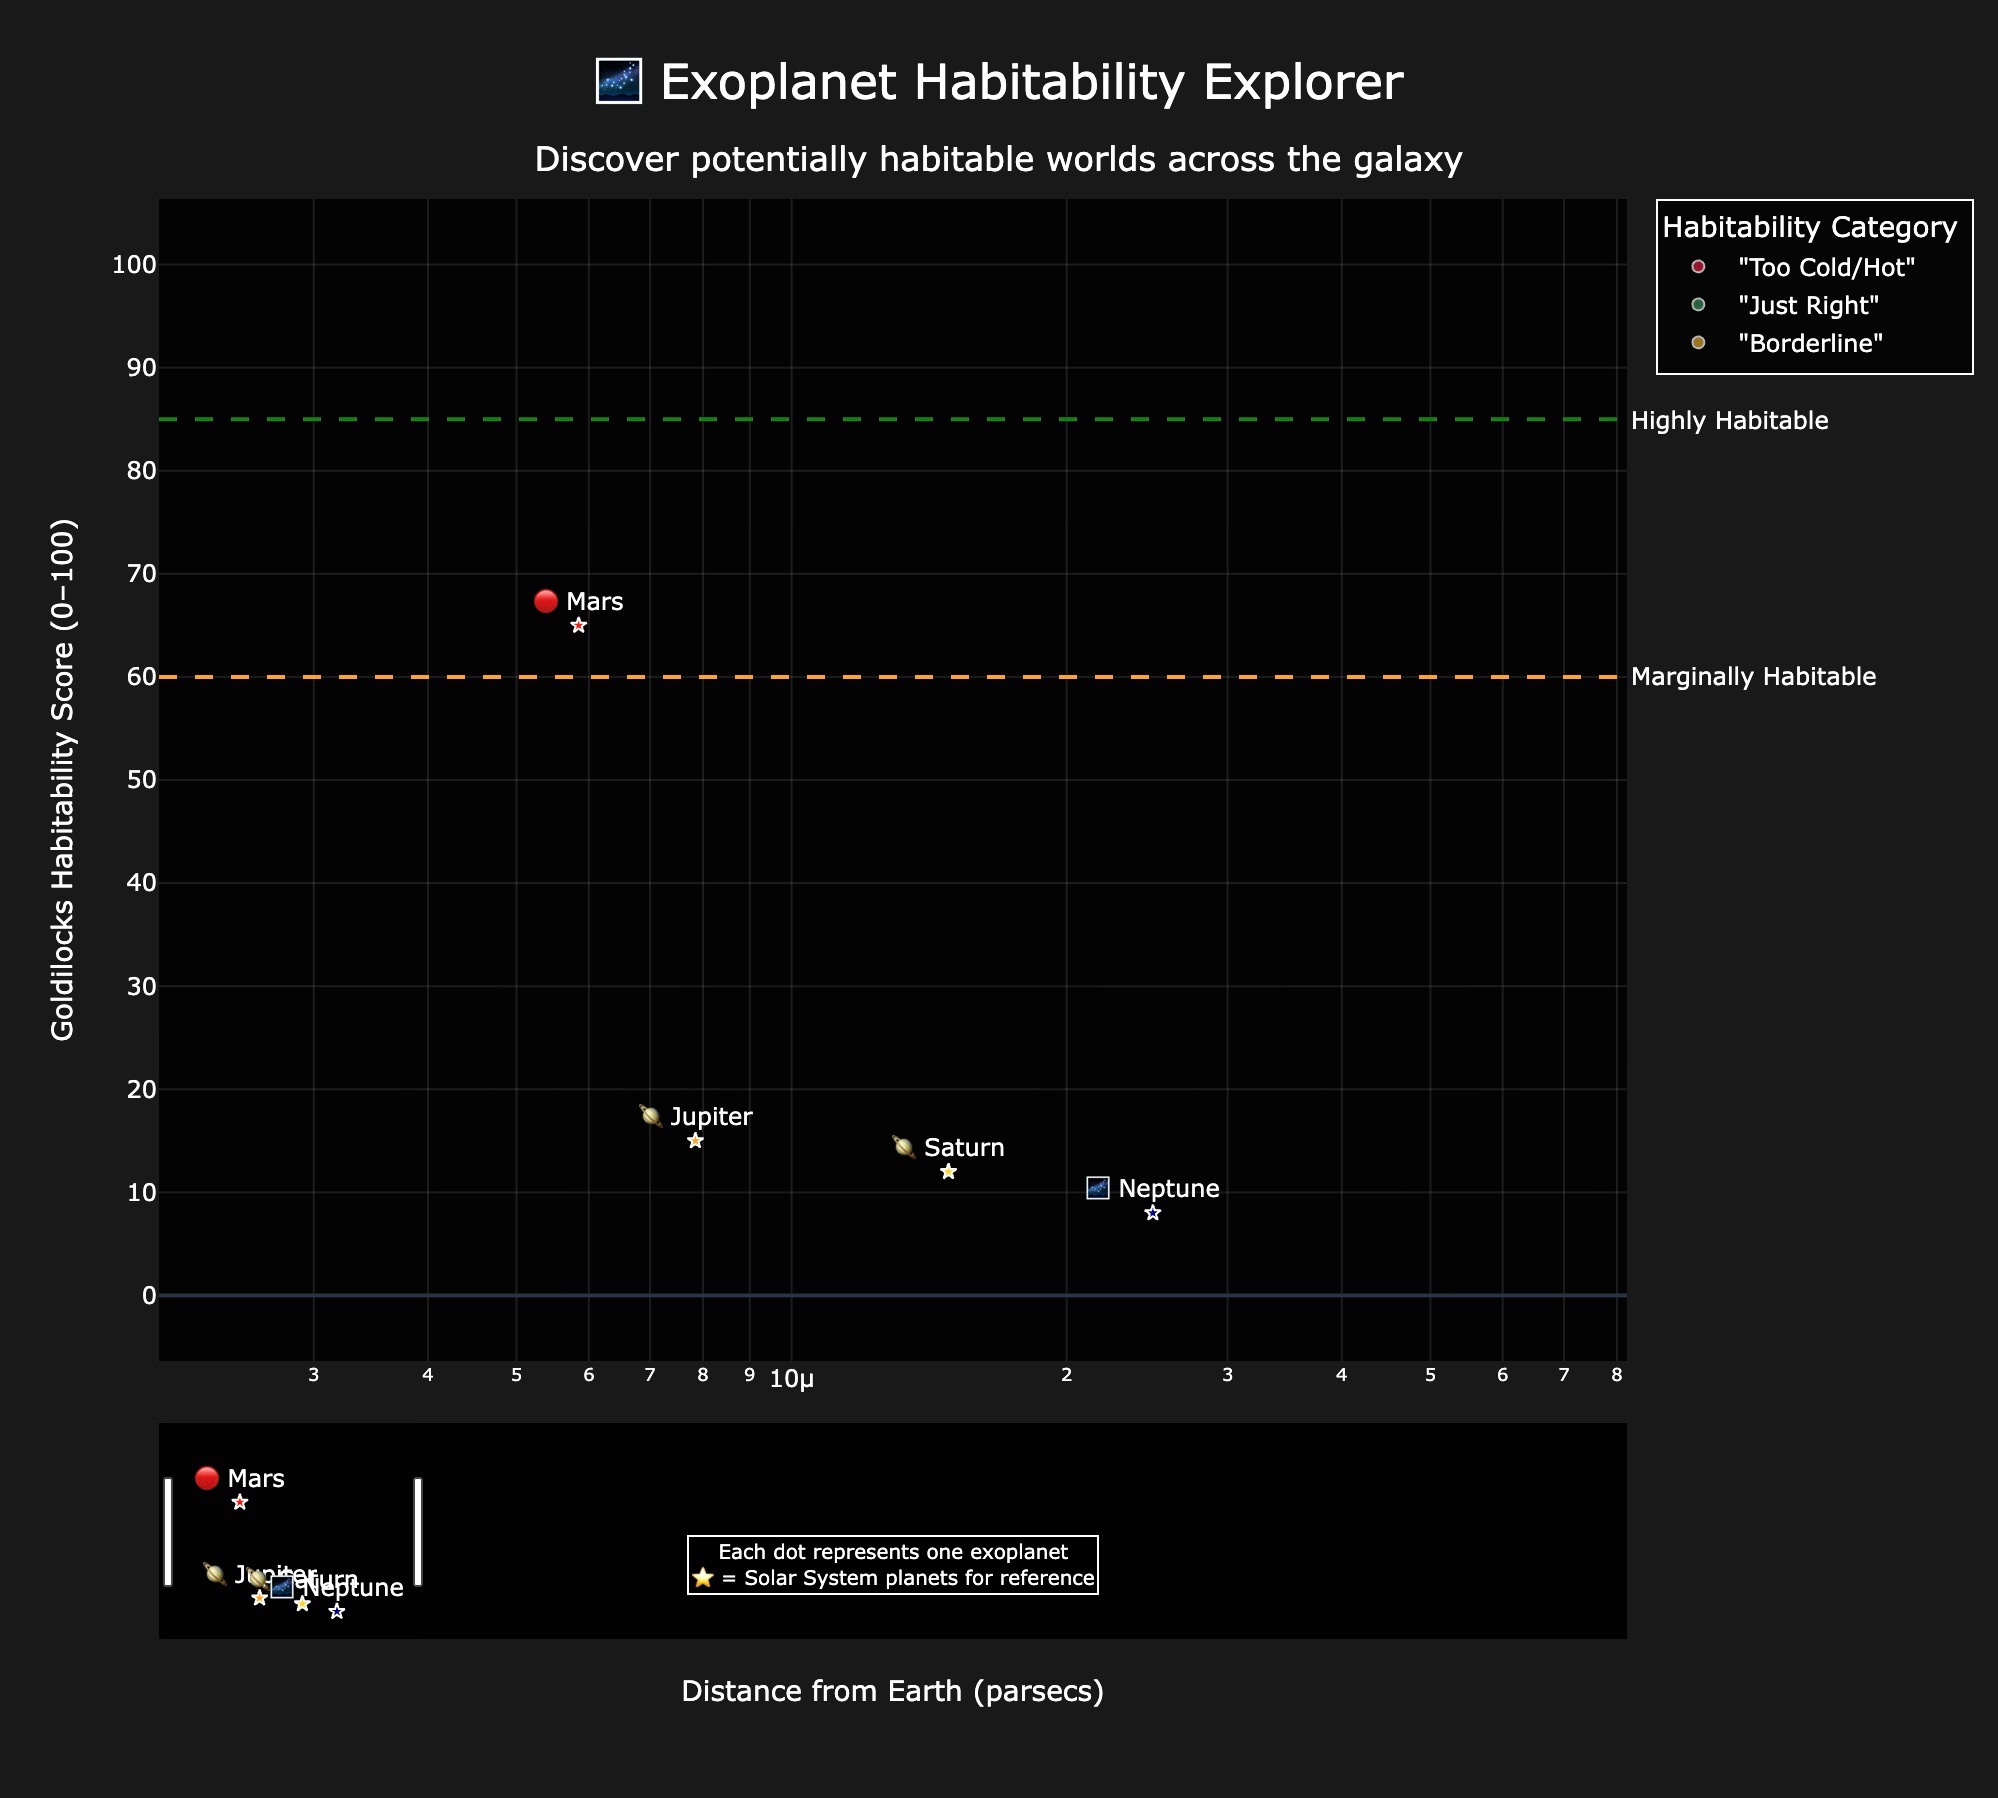
Our Solar System Habitability Visualization
-
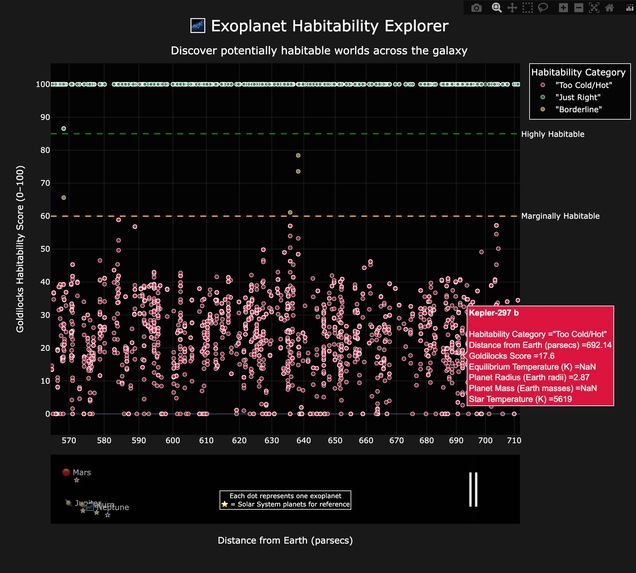
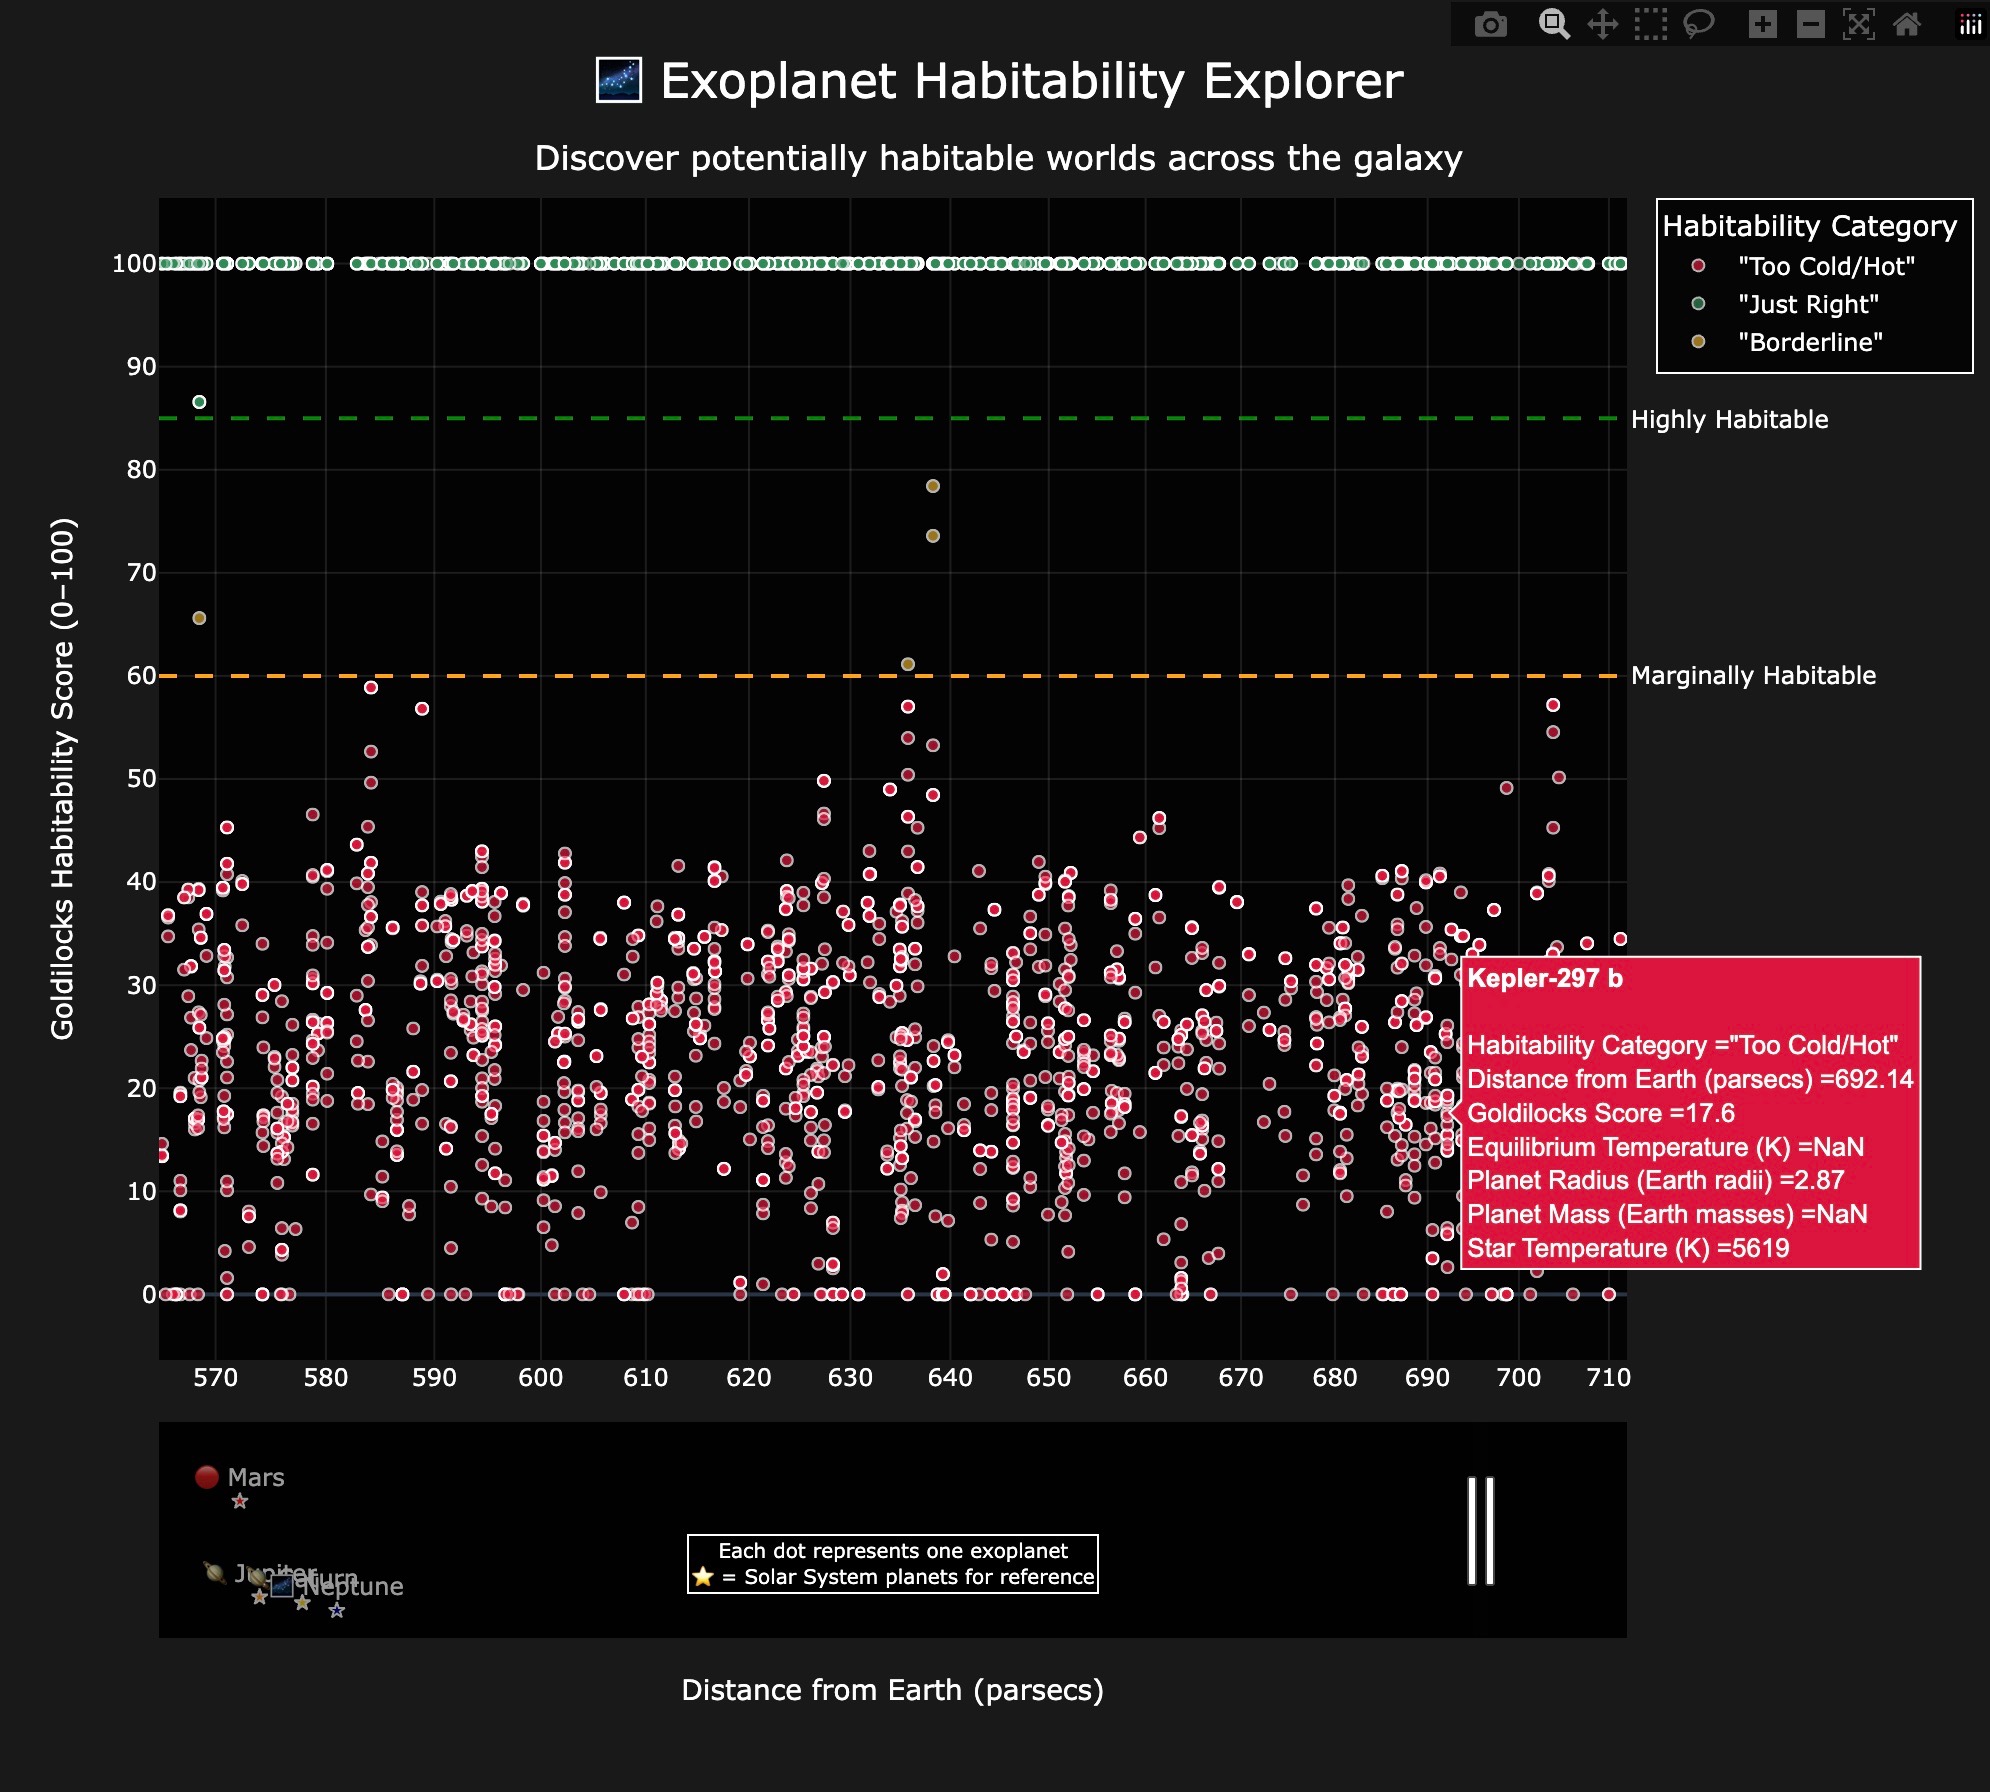
Exoplanet Habitability Visualization: Zoomed in
-

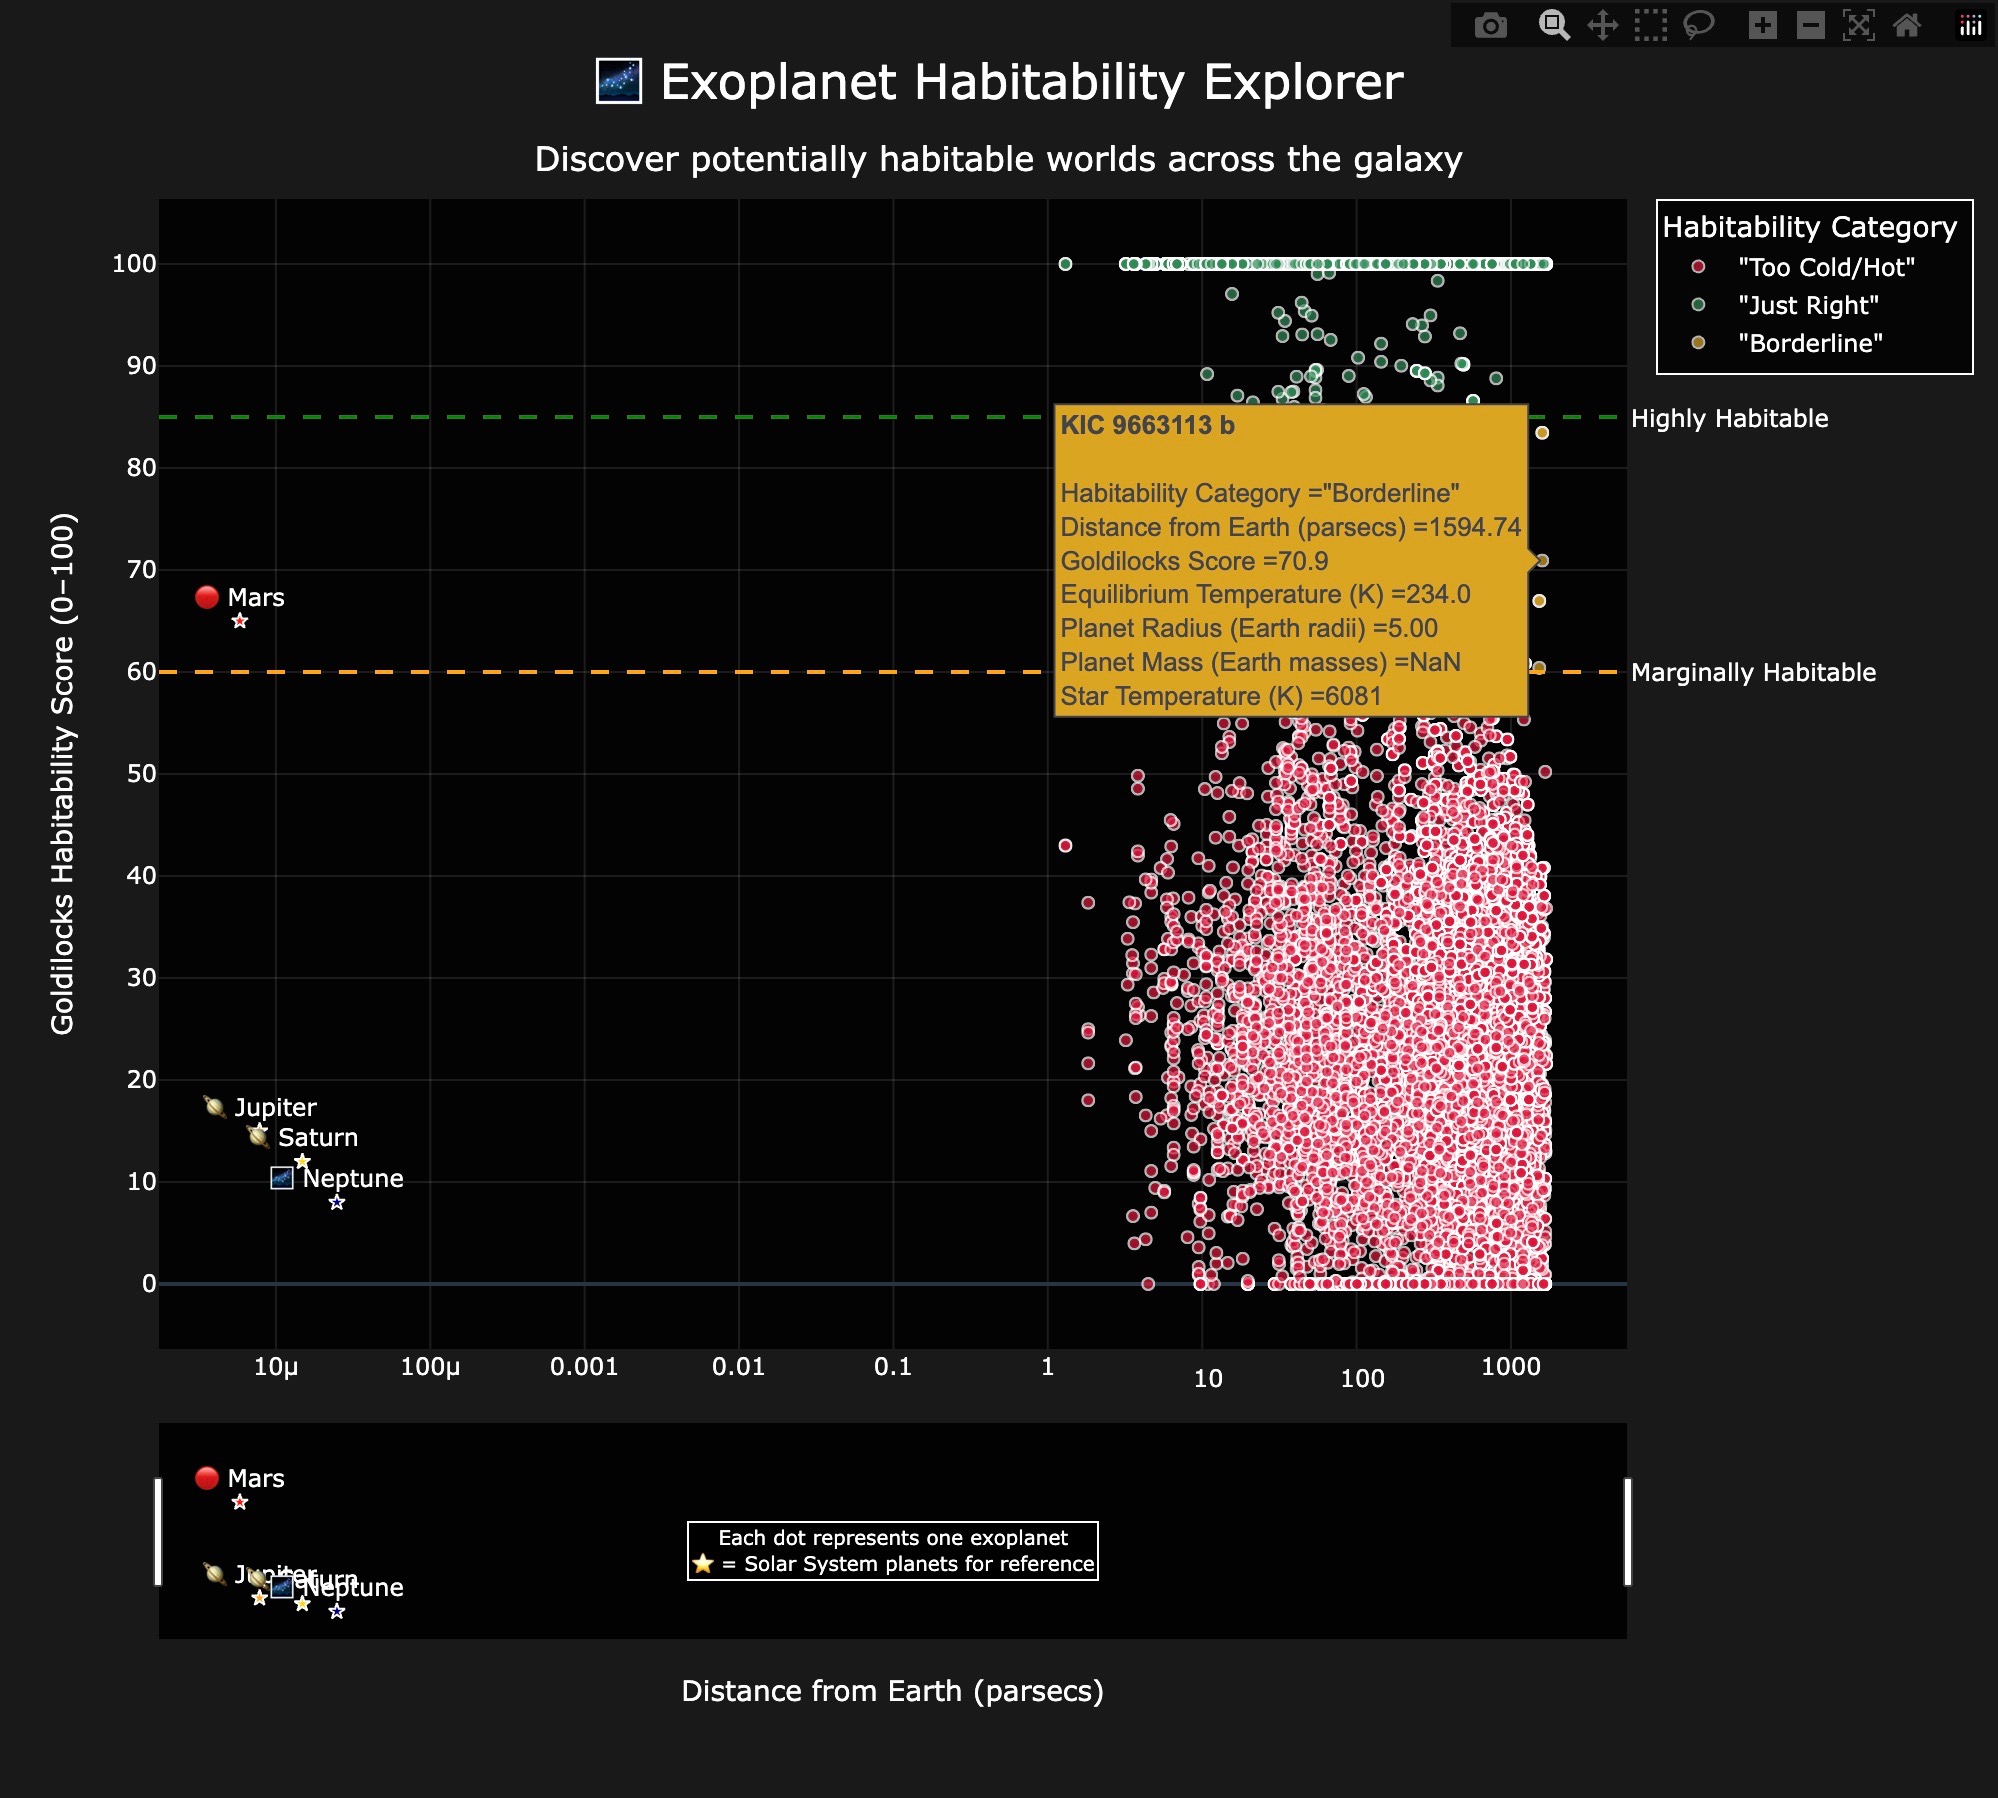
Exoplanet Habitability Visualization: Zoomed out
-

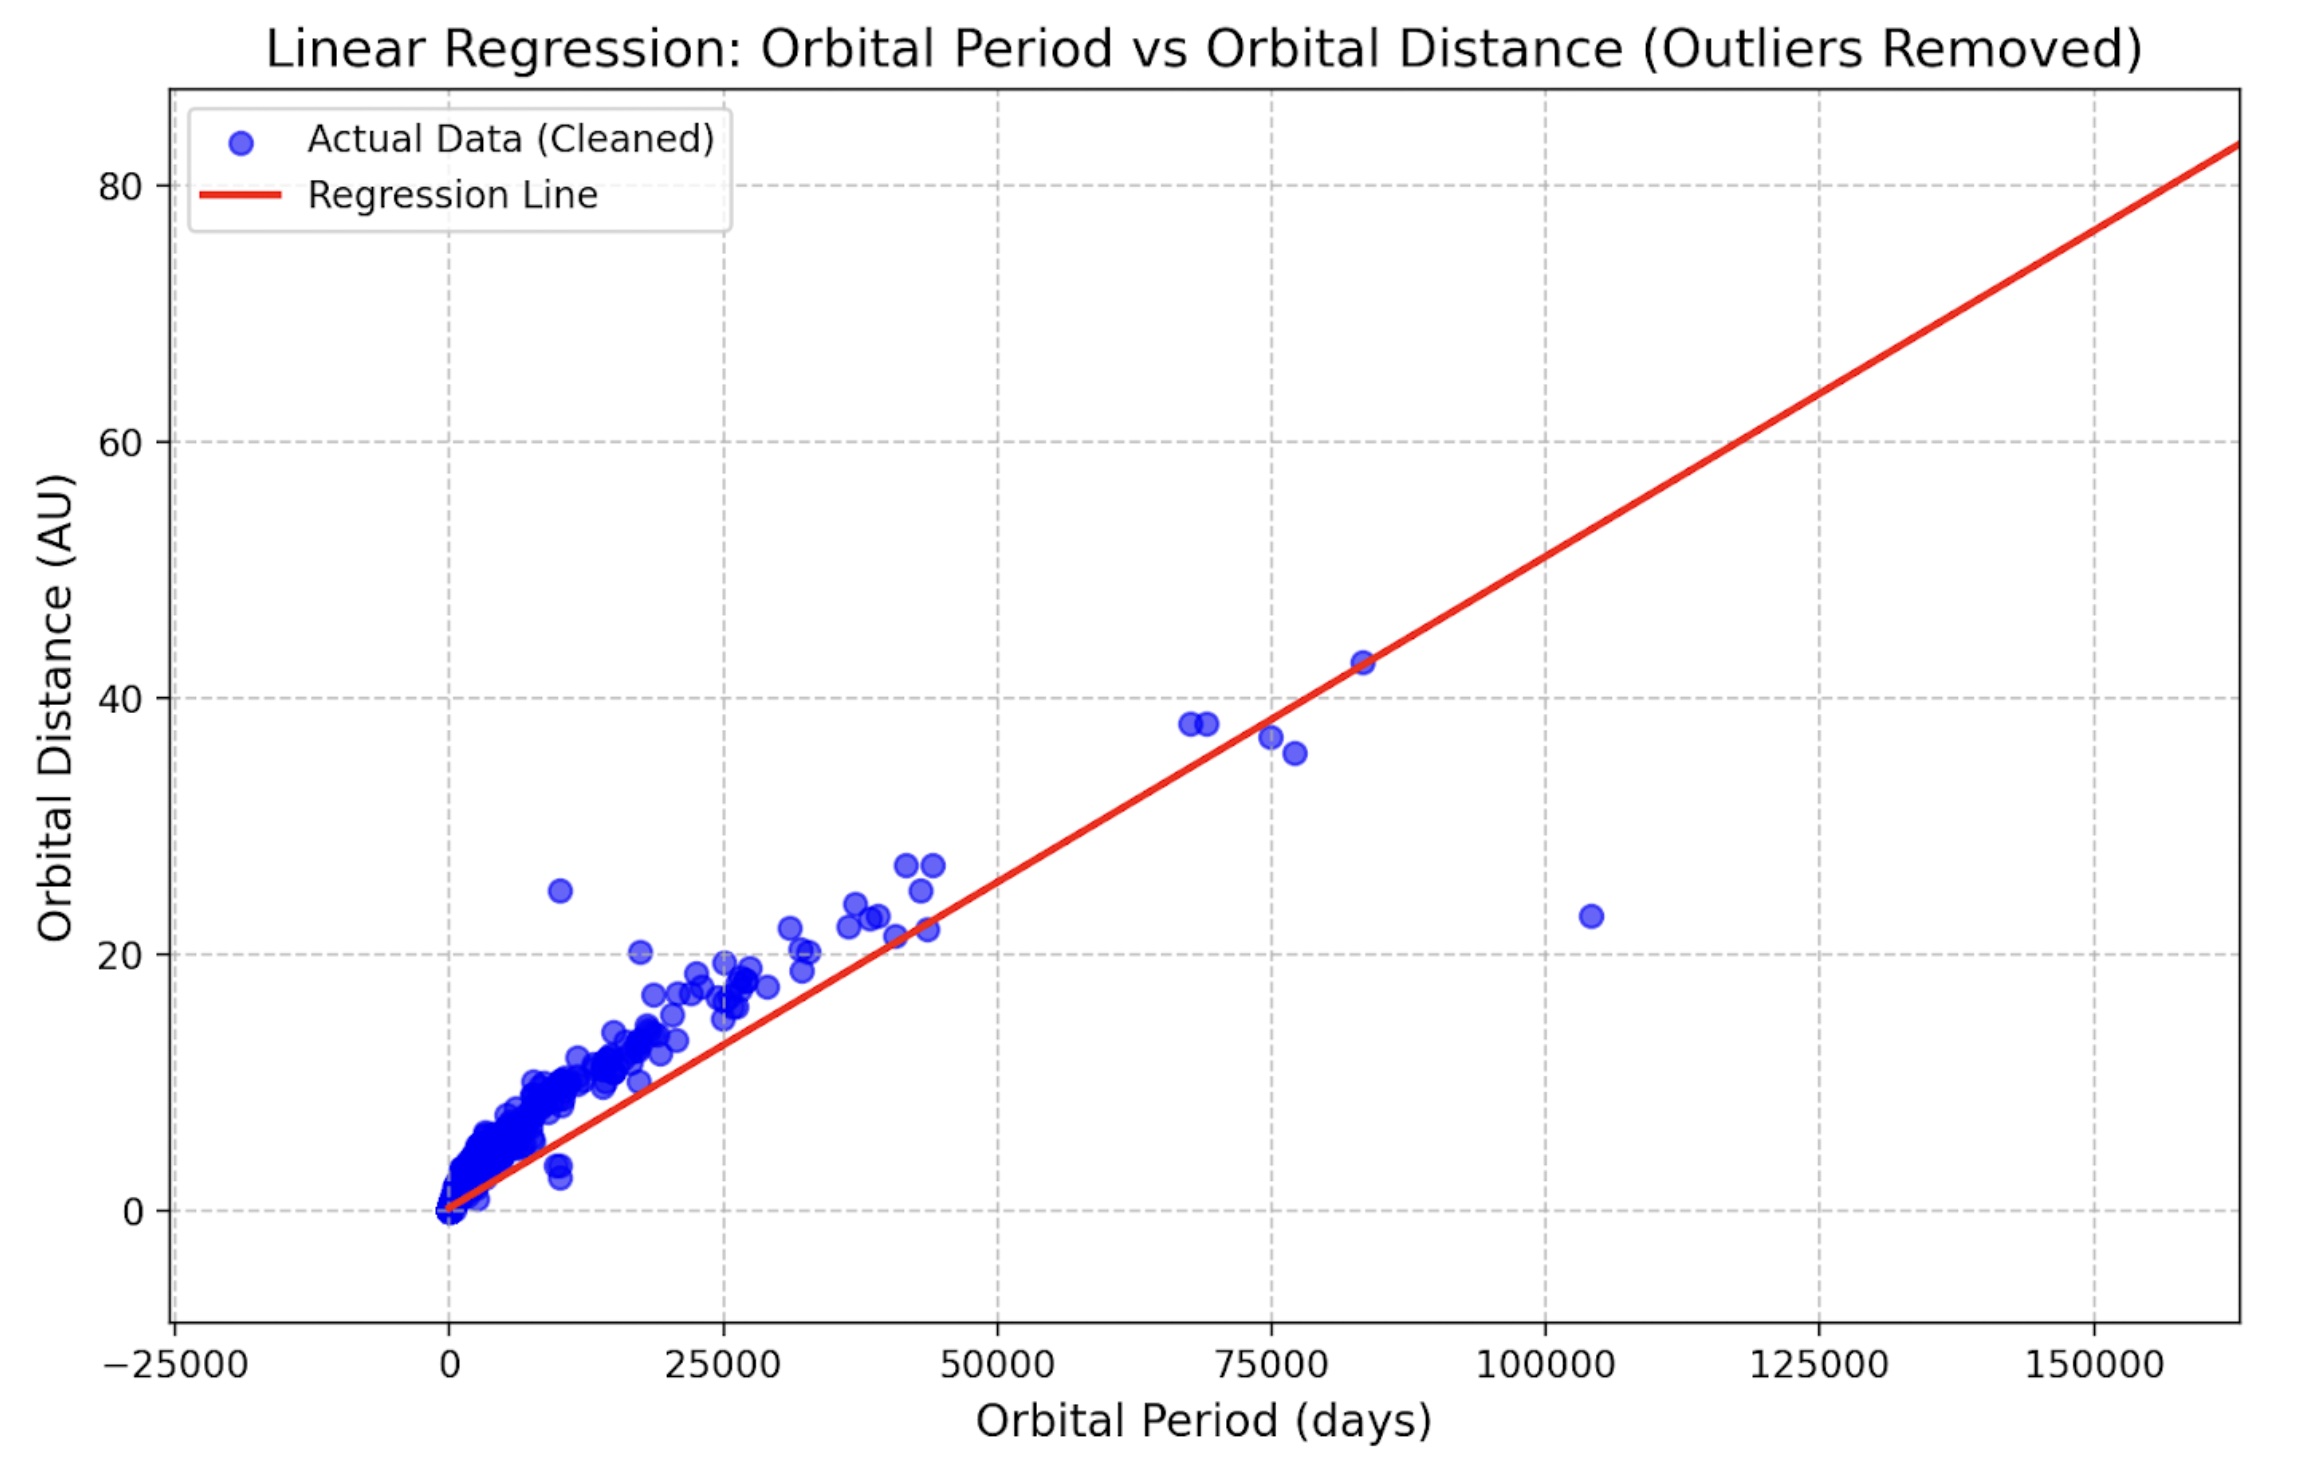
Linear Regression Initializer
-
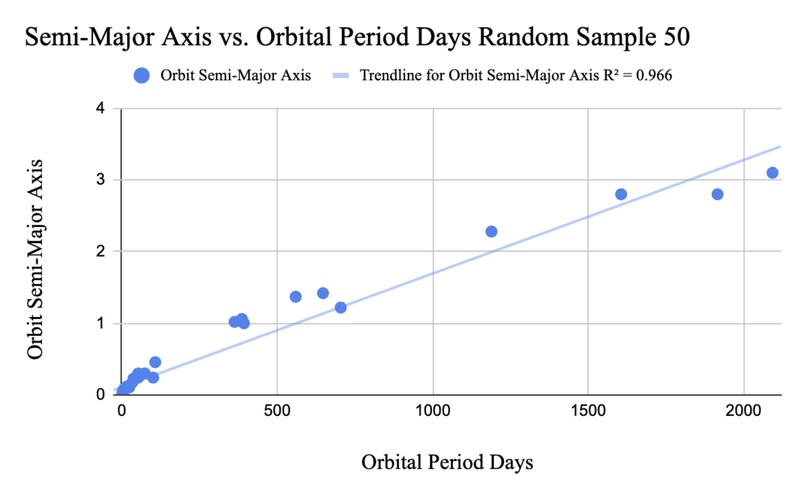
Random Sample Regression Test
-

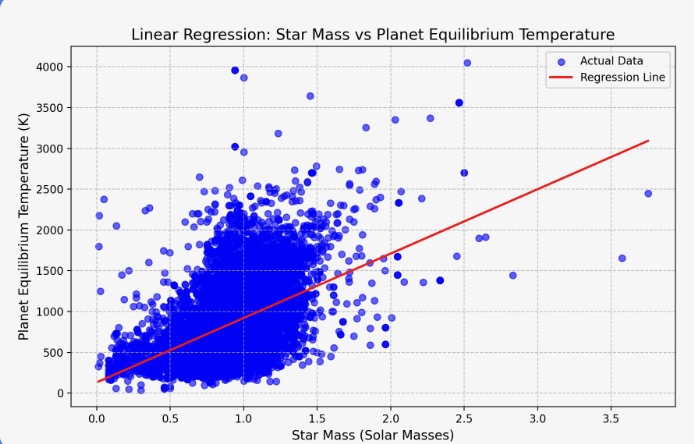
Star Mass vs. Planet Equilibrium Temperature
-
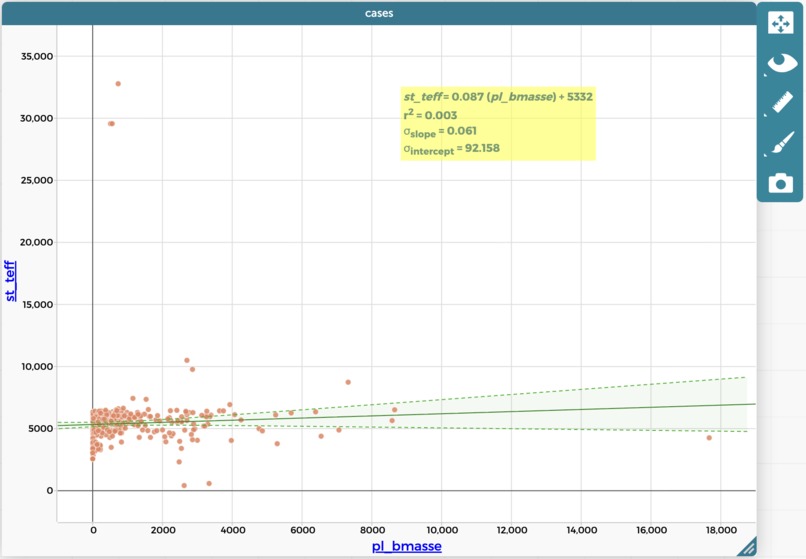
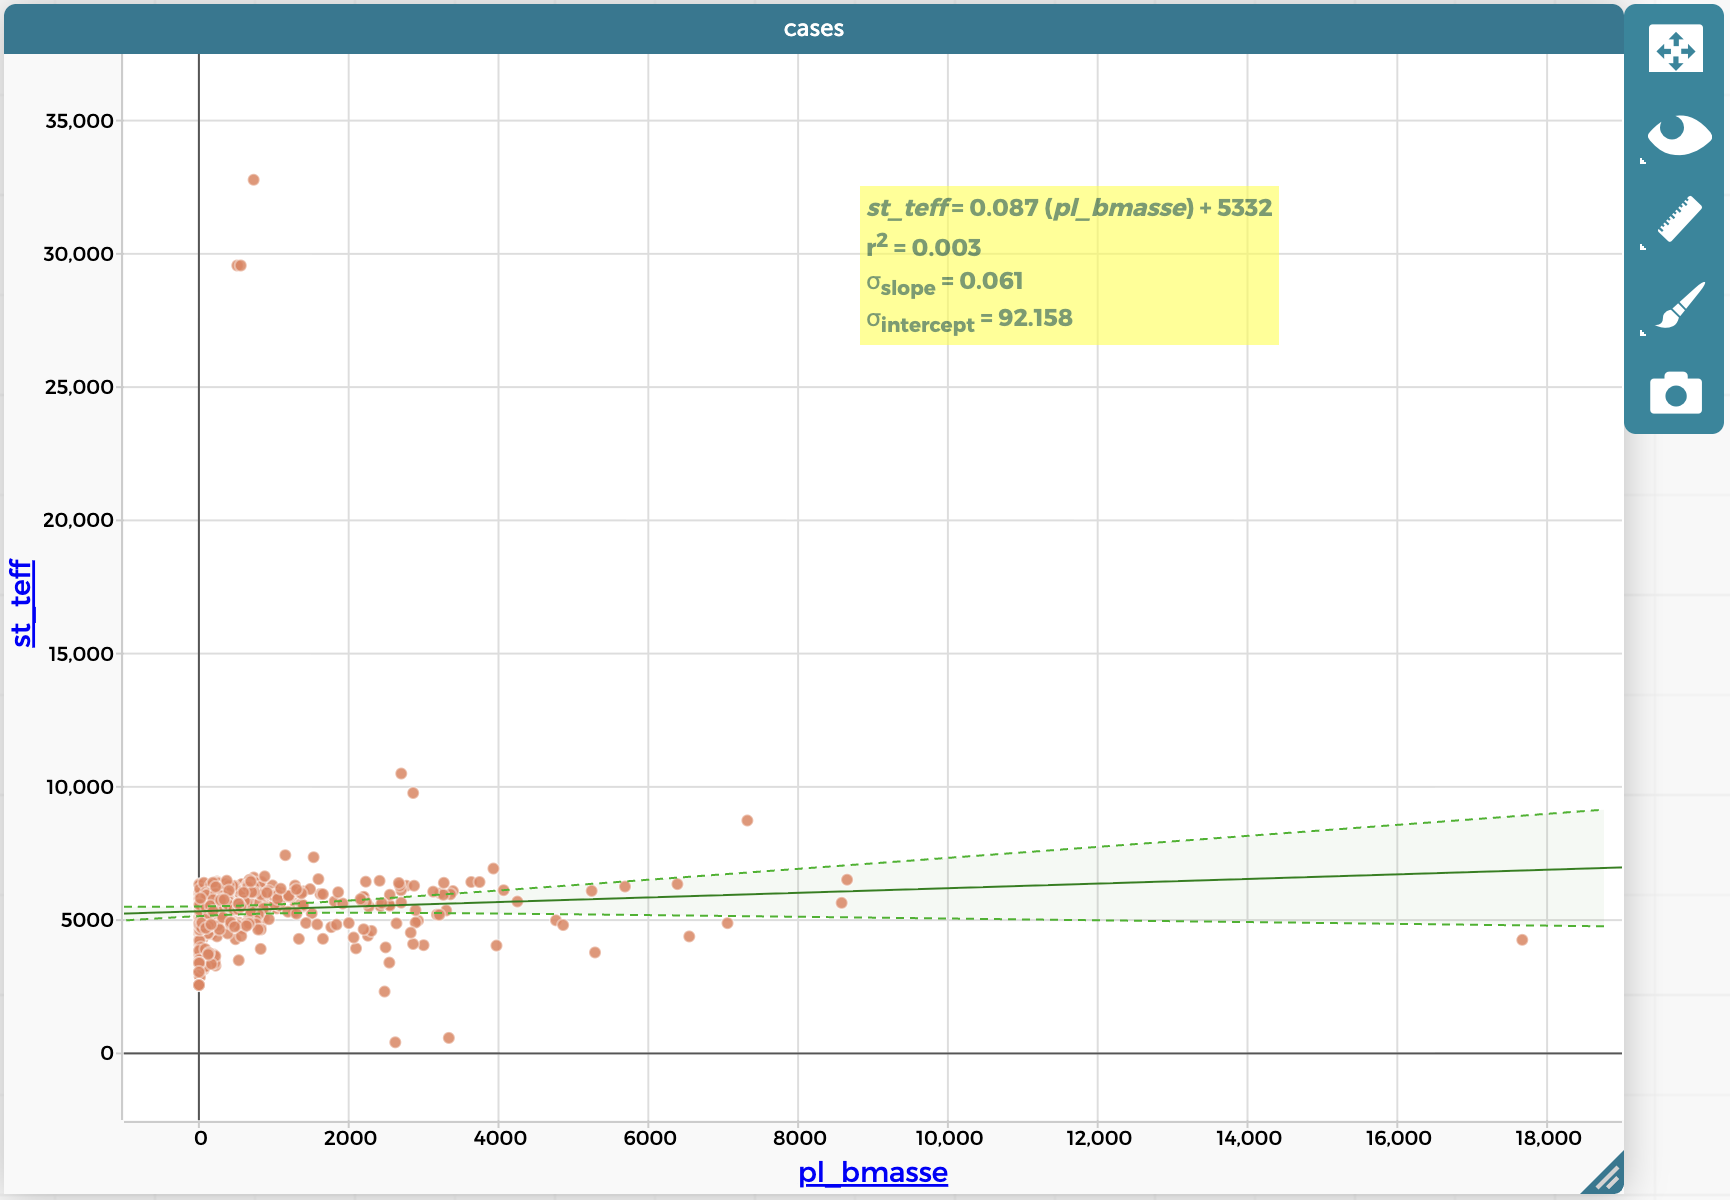
Host Star Mass vs. Planet Mass
-
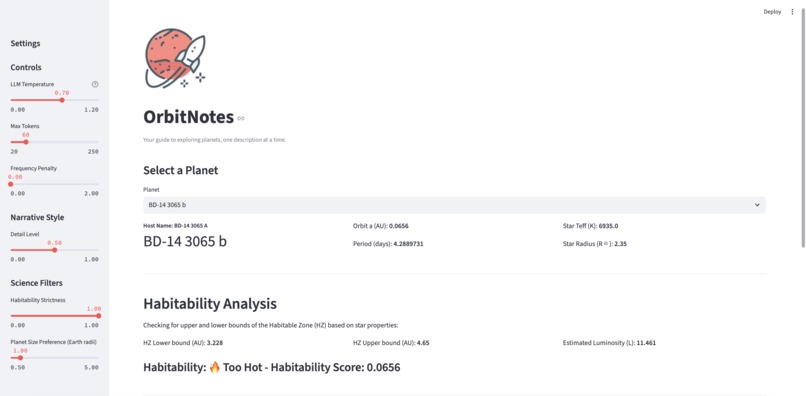
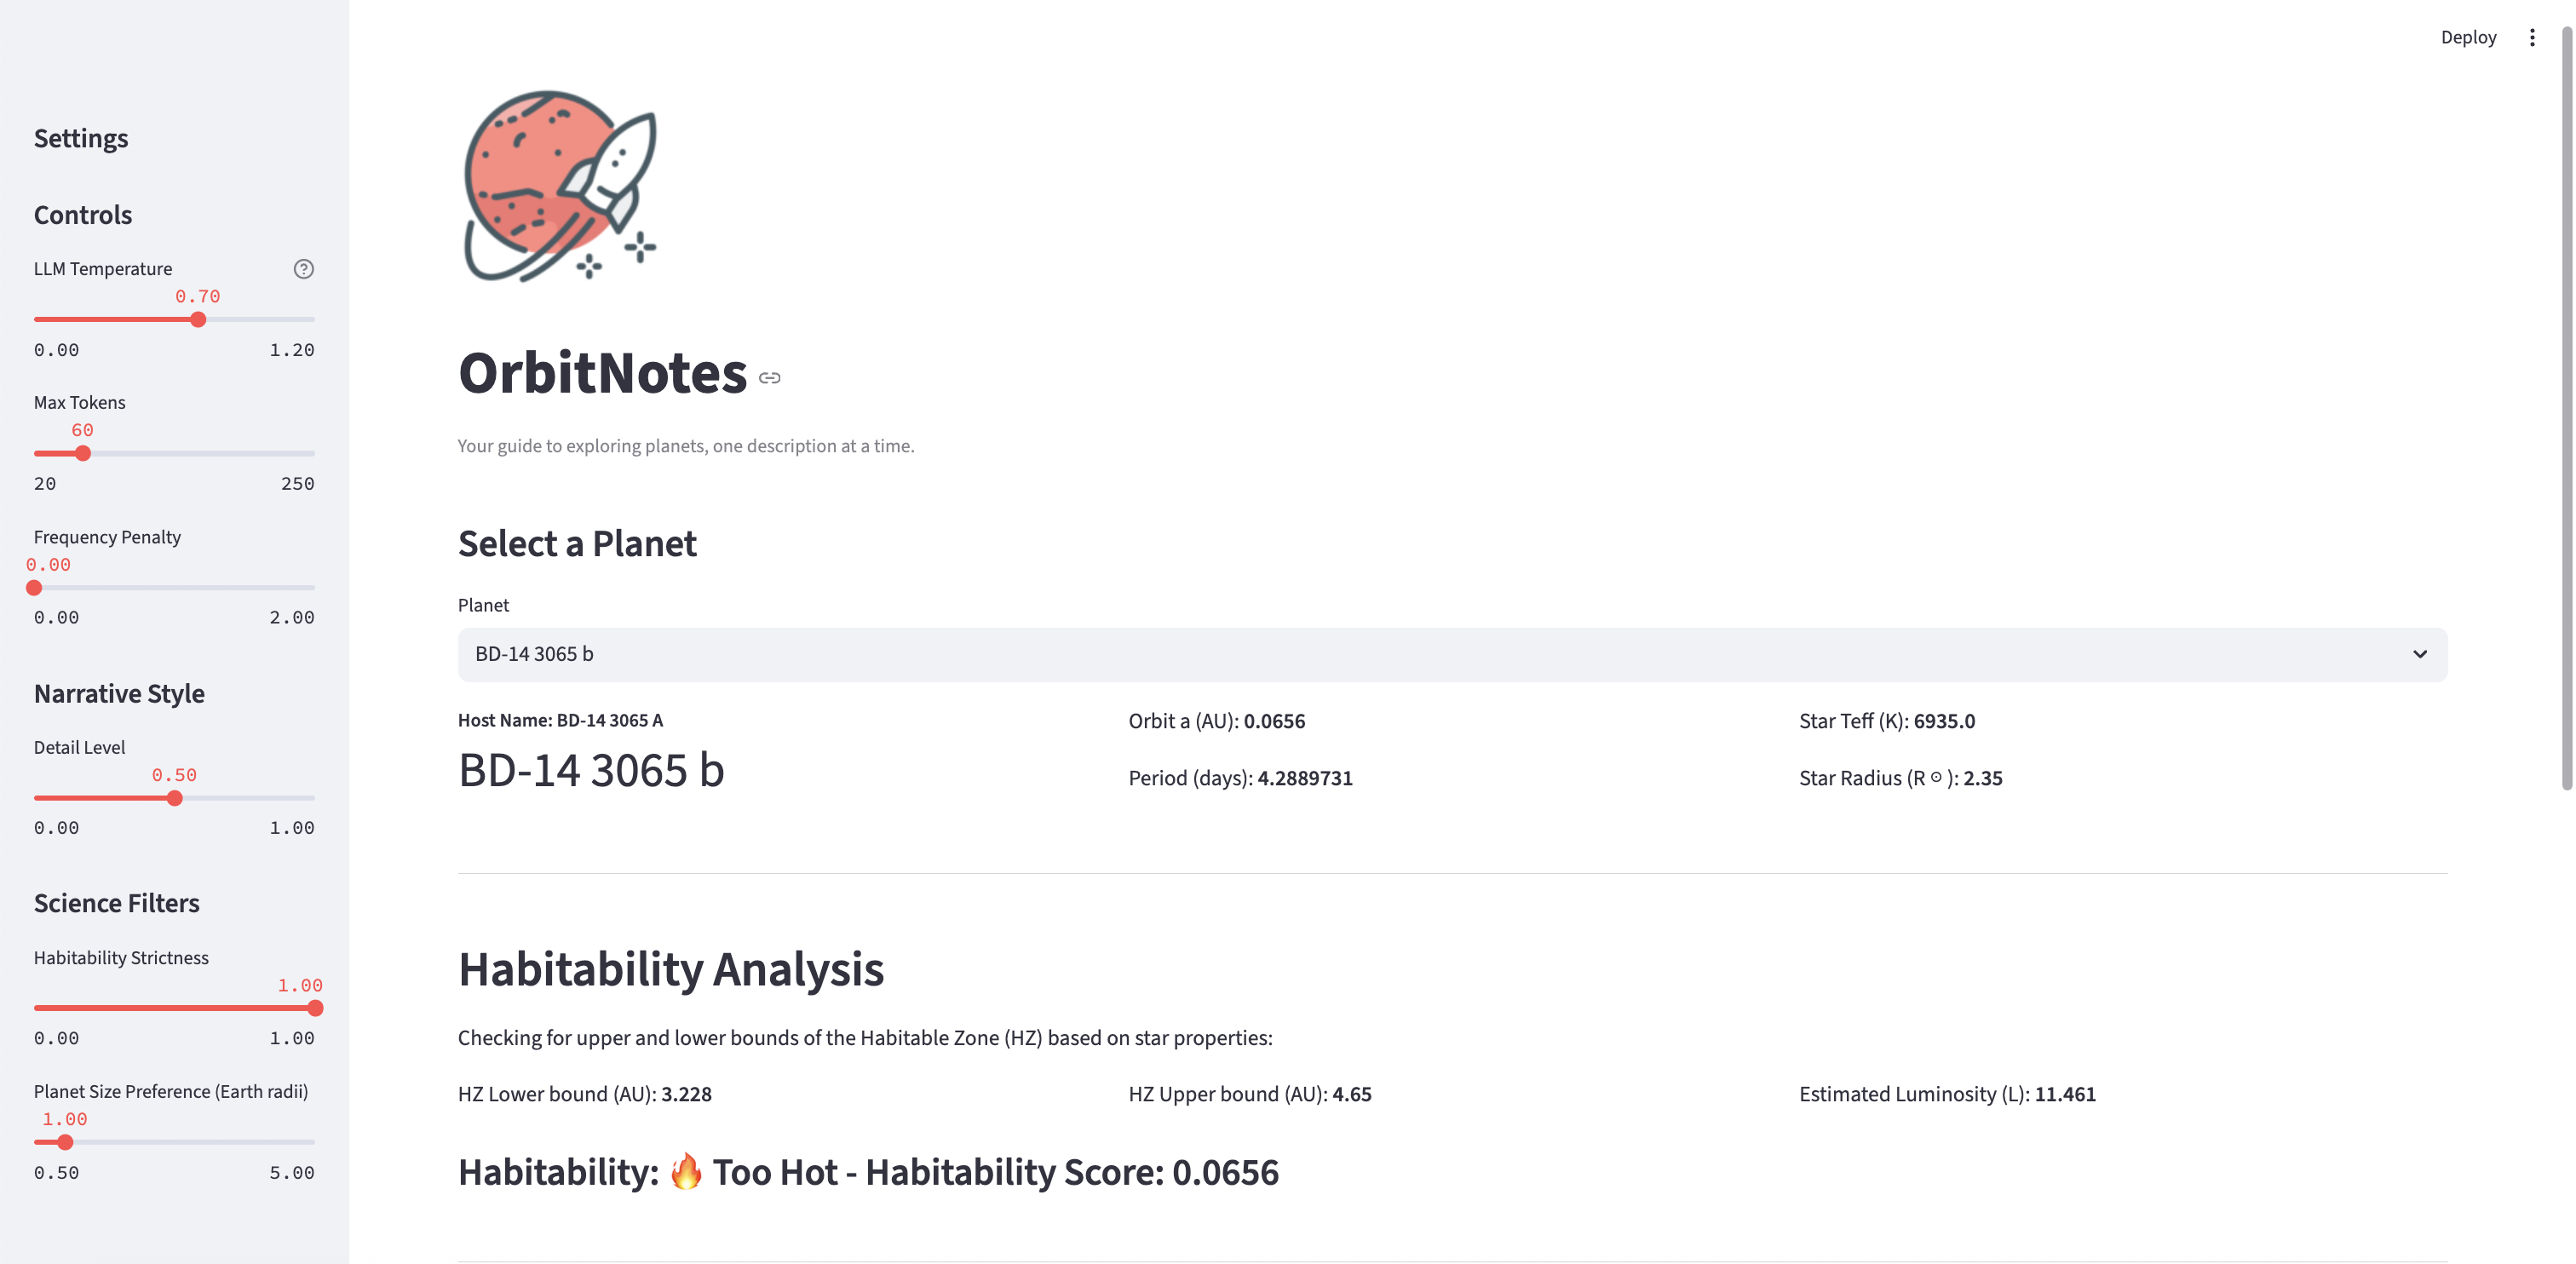
OrbitNotes, a LangChain and Streamlit app

Inspiration
Ever since astronomers confirmed the existence of exoplanets, one big question has captured human imagination: “Are there other Earth-like worlds out there?” Inspired by NASA missions like Kepler and TESS, and guided by the CDC’s space theme, we wanted to build a tool that connects astrophysics with data science. Our goal was to identify Goldilocks planets: those that are not too hot, not too cold, but just right for life.
Our Products
OrbitNotes
OrbitNotes is an interactive Streamlit app that lets users select an exoplanet, analyze its habitability zone, and view its stellar and planetary properties. It also generates short AI-powered descriptions using LangChain, blending data accuracy with accessible storytelling.
RoguePlanets
RoguePlanets identifies unusual or outlier planets in the NASA Exoplanet Archive using z-score analysis. By flagging planets with extreme values in orbital distance, size, or stellar properties, it improves the accuracy of our habitability scoring and highlights anomalies worth further investigation.
ExoplanetsVisualizer
ExoplanetsVisualizer is an interactive Plotly dashboard that plots thousands of planets on a Goldilocks Score vs. distance chart. It classifies them as Too Hot, Too Cold, or Just Right, includes hover details for each planet, and integrates Solar System references for context, making complex data easy to explore.
What We Learned
This project taught us how to blend physics, data science, and visualization: How astronomers apply Kepler’s Third Law: $$ P^2 \propto a^3 $$ where P is the orbital period and a is the semi-major axis. This showed us the deep correlation between a planet’s orbit and its distance from its star.
How to calculate a star’s luminosity from its radius and temperature: $$ L = R_\star^2 \left(\frac{T_\star}{5778}\right)^4 $$
How to derive the habitable zone (HZ) boundaries: $$ 9HZ_{inner} = \sqrt{\frac{L}{1.1}}, \quad HZ_{outer} = \sqrt{\frac{L}{0.53}} $$
(These formulas are on the slides in a readable format)
How to build a Goldilocks Score (0–100) that combines orbital distance, planet size, orbital stability, and stellar friendliness. How to use Python (Pandas, NumPy) for data cleaning and scoring, and Plotly for interactive visualizations.
How We Built It
Data Collection – We started with NASA’s exoplanet archive and filtered down to planets with valid orbital and stellar properties. Physics Foundations – Using stellar radius and temperature, we computed luminosity and habitable zone ranges for each star.
Scoring Model – We assigned each planet a Goldilocks score:
- 100 if perfectly centered in the habitable zone.
- Lower scores the farther a planet was from the habitable zone edges.
- Adjustments for planet size, eccentricity, and star properties.
Visualization – Built an interactive dot plot where:
- X-axis = distance from Earth
- Y-axis = Goldilocks Score (0–100)
- Color = habitability category (Too Hot, Too Cold, Just Right)
- Hover shows key details about each planet.
Challenges We Faced
Data Gaps – Many planets were missing size or mass values, forcing us to decide whether to approximate or exclude them.
- Physics vs. Simplicity – We wanted a rigorous model but one that judges could easily follow.
- Visualization Overload – With thousands of planets, we had to optimize our chart for clarity and interactivity.
- Hackathon Time Crunch – Translating astrophysical equations into working, tested Python code within the deadline was a real challenge.
Findings
Out of ~36,000 planets analyzed: ~48.7% were highly habitable candidates ~0.5% were borderline habitable ~50.8% were unlikely to be habitable Regression testing confirmed Kepler’s Third Law with an R^2 = 0.84. Only a small fraction of planets are truly “Earth-like,” showing just how rare habitable conditions are in the universe.
Applications
Astronomy Research – Helps scientists prioritize exoplanets for deeper investigation. Future Missions – Supports planning for telescopes like LUVOIR, HabEx, and Ariel. Climate Science – Allows comparison of planetary conditions to better understand Earth’s climate balance. Education & Outreach – Makes complex astrophysics accessible through a simple, interactive Goldilocks scale.
Takeaway
This project showed us that while the galaxy is full of planets, the ones with Earth-like potential are incredibly rare. By blending astrophysics equations, data science, and visualization, we created a tool that not only demonstrates the science but also inspires curiosity about the universe — reminding us how special our own Goldilocks planet, Earth, truly is.


Log in or sign up for Devpost to join the conversation.