-
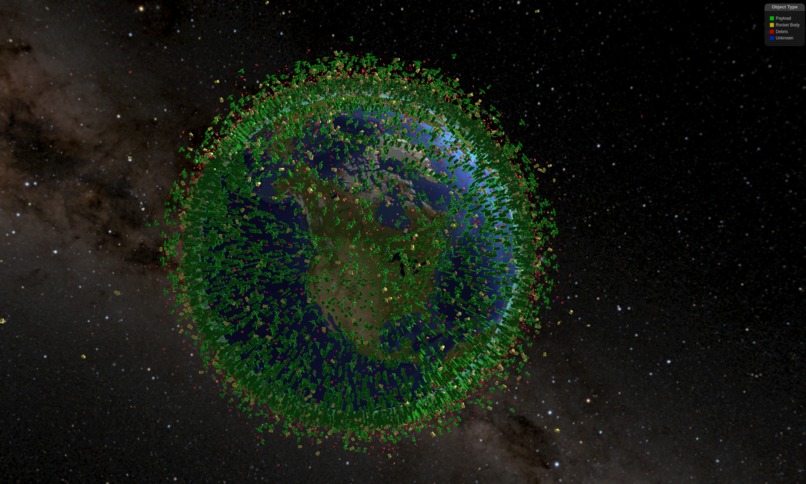
LEO Population: Active Satellites & Rocket Bodies
-
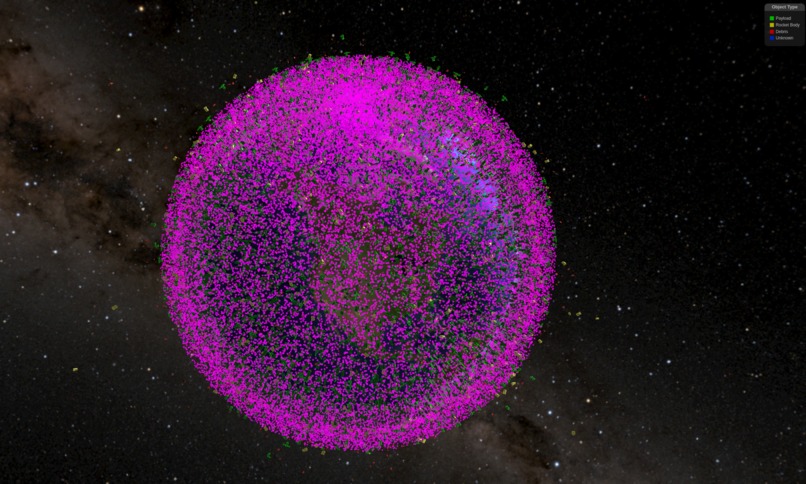
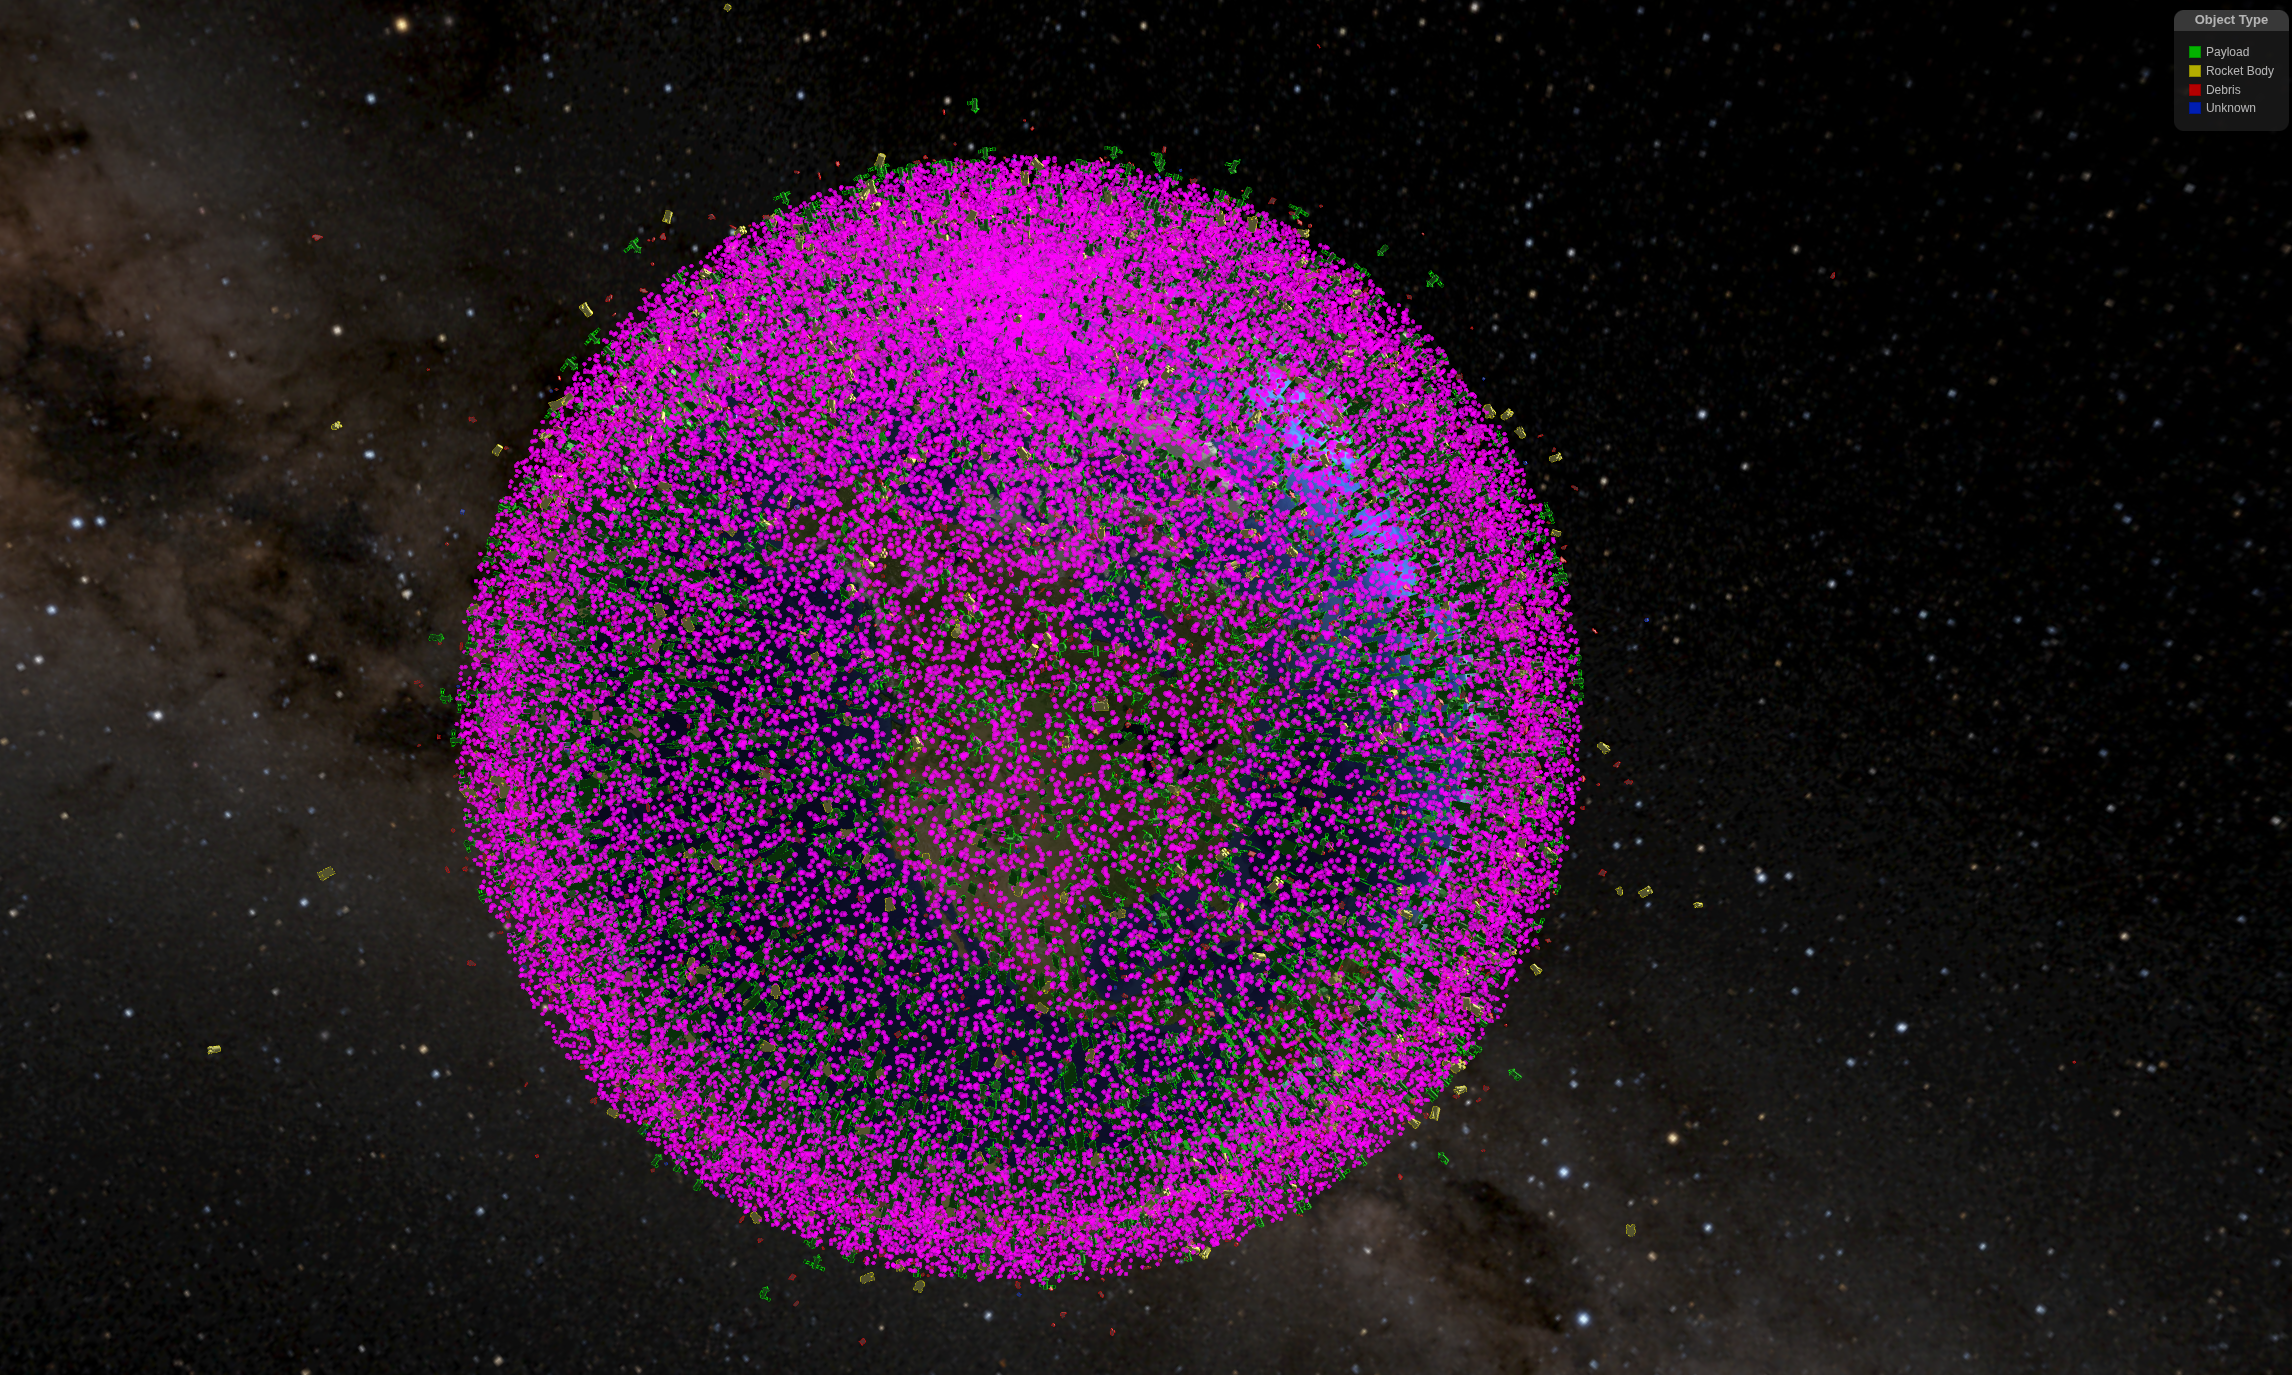
LEO Population: All Tracked Objects (Including Debris)
-

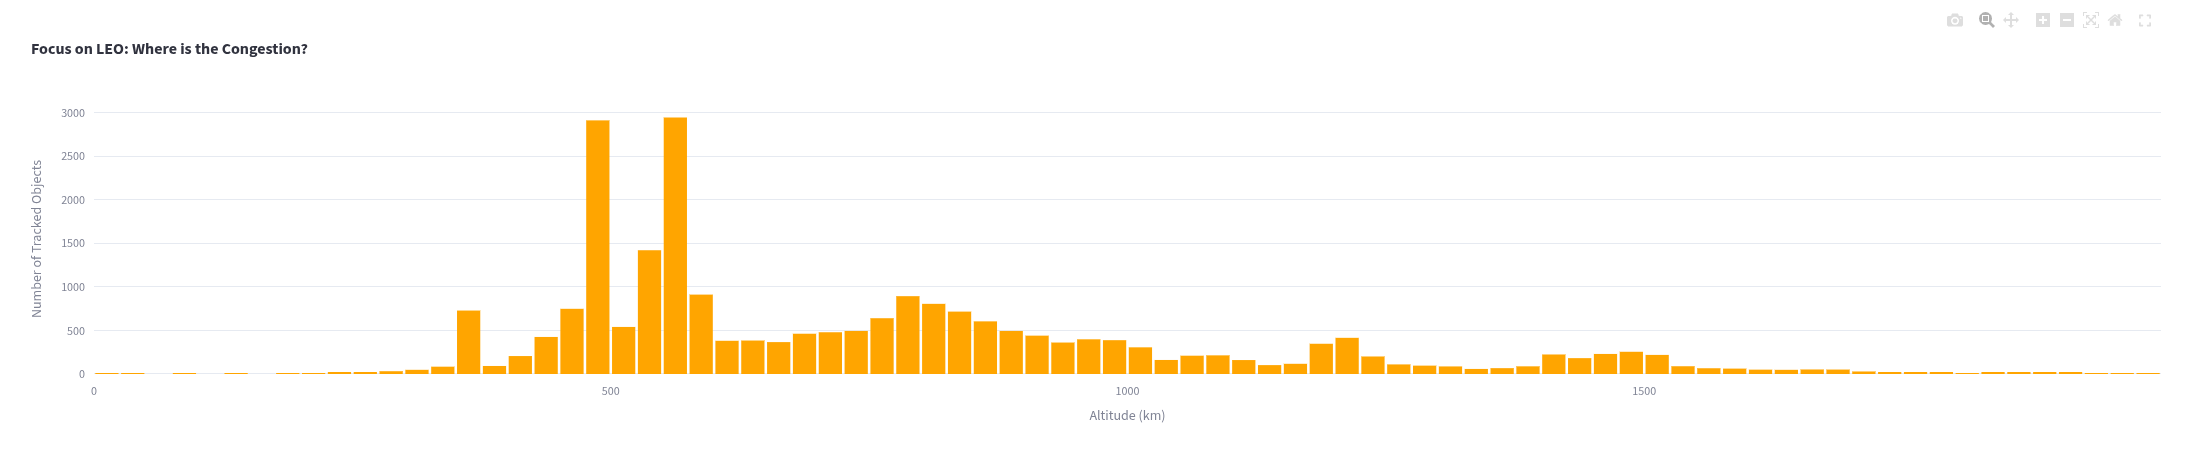
Number of (Tracked) Objects in Orbit by Altitude

The Story of Our Project
Our project, "Kessler Syndrome: The Gravity of the Situation," was inspired by a single question that emerged after reviewing the provided hackathon datasets: What is the true cost if the entire 'Zero Gravity' world, so vividly described in the data, suddenly vanished?
The Business Track's Space Economy dataset showed us a thriving multi-billion dollar industry. The Natural Science Track's Planetary Systems data revealed an explosion of scientific discovery, and the Social Science Track's International Astronaut Database told a story of growing global collaboration. We realized the most impactful story wasn't in any single dataset, but in the catastrophic void their combined disappearance would leave behind. This led us to model a Kessler Syndrome event, a catastrophic chain reaction of orbital debris that would permanently sever our access to space. How We Built It
Our project is a multi-phase interactive dashboard built in Python using Streamlit and Plotly. Our methodology was a narrative fusion of the provided datasets:
Establishing the Stakes: We began with the Space Economy dataset. We built a robust parser to extract value, employment, and gross output data, creating visualizations that established the direct financial shock of losing this critical industry.
Quantifying the Human Cost: Next, we analyzed the International Astronaut Database and the Planetary Systems data. This allowed us to build powerful charts showing the abrupt end of 60 years of human exploration, scientific discovery, and global partnership.
Modeling the Cascade: To meet the Grad Track's challenge, we went a step further. We wanted to understand the systemic consequences of losing the industry detailed in the Space Economy data. Using pymrio and the EXIOBASE 3 global economic model, we performed a live "demand shock" simulation. This calculated the cascading failures from the loss of space-related sectors through the entire U.S. economy, revealing hidden dependencies and the true scale of the disaster.
Challenges We Faced
Our primary technical challenge was implementing the economic cascade simulation under a tight deadline. The global economic model is massive and complex. Mapping the specific industries from the provided Space Economy dataset to the high-level sectors within the model required significant data exploration and careful approximation. Debugging the simulation to ensure the economic shock propagated correctly was a major hurdle that took dedicated, focused effort to overcome. What We Learned
Throughout this process, we learned that the numbers in the Space Economy dataset are just the tip of the iceberg. Our simulation, which was prompted by that very dataset, revealed that for every dollar of value listed, there are several more dollars of dependent economic activity in seemingly unrelated sectors like financial services and real estate.
The provided datasets show us what we have in space; our project's accomplishment was to build a system that shows how deeply integrated and vital that value is to our entire modern society. We're proud to have synthesized data from three different tracks into a single, cohesive, and impactful narrative that reveals the true gravity of the situation.


Log in or sign up for Devpost to join the conversation.