-
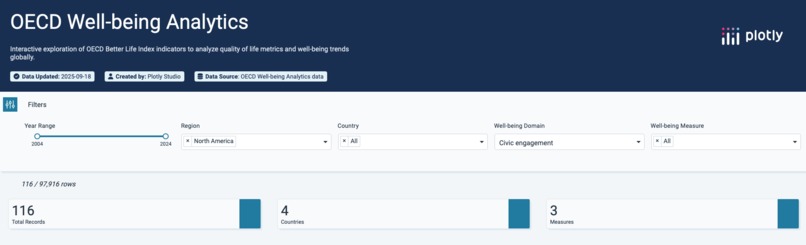
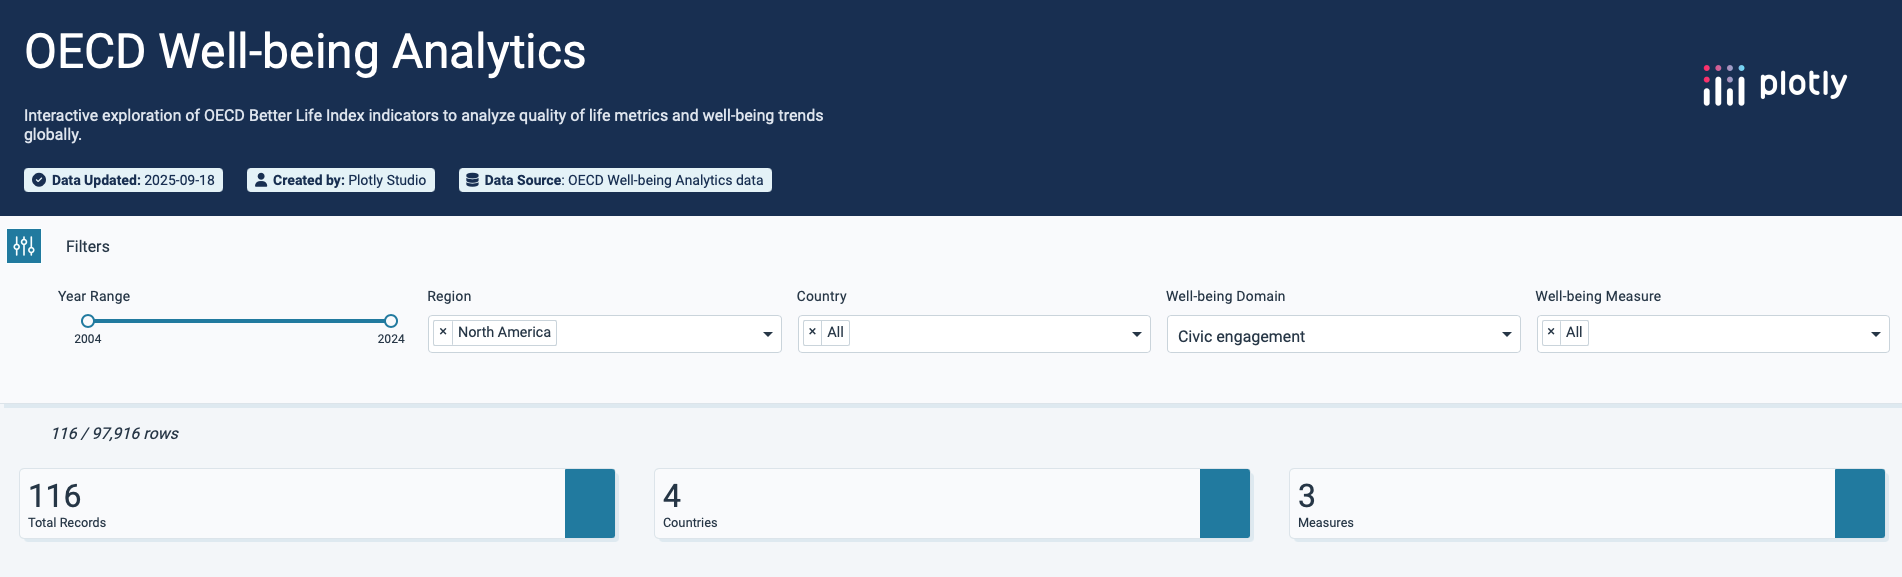
OECD Wellbeing Analytics
What it does
The app analyzes OECD Better Life Index indicators to analyze quality of life metrics and well-being trends globally.
How we built it
It was built using plotly studio, plotly cloud and dash
Challenges we ran into
Learning how to use plotly studio, fine-tuning the contexts and updating dash to improve the code
Accomplishments that we're proud of
Learning about plotly studio and plotly cloud
What we learned
Was able to learn more about dash and plotly studio
What's next for OCED Wellbeing Analytics
- Add country similarity ranking using cluster analysis

Log in or sign up for Devpost to join the conversation.