-
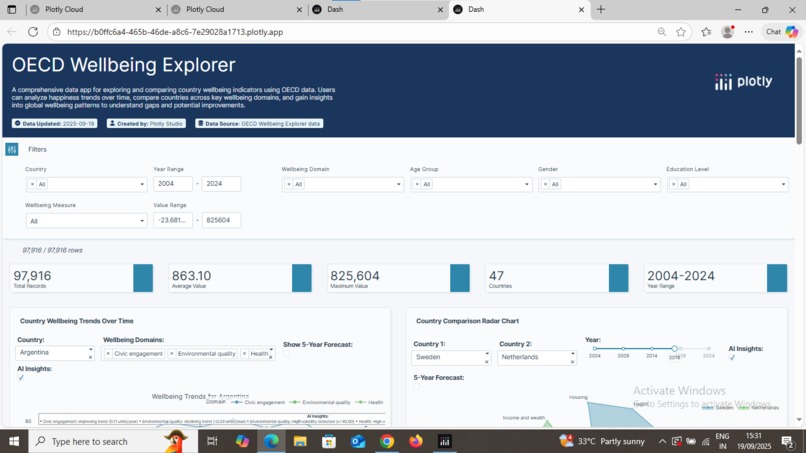
Global Happiness Explorer – Interactive dashboard comparing wellbeing across countries.

Inspiration
I was inspired by the importance of quality control and data-driven insights in manufacturing. Industries need quick and reliable tools to monitor product quality, compare performance, and identify problem areas. This motivated me to create an interactive dashboard app that brings clarity to complex data.
What it does
The Manufacturing Quality Control Data App allows users to: Upload datasets related to manufacturing performance. Visualize defect rates, production efficiency, and quality trends. Compare performance across different countries and categories. Gain insights instantly through dynamic and interactive graphs.
How I built it
Dash + Plotly: for building the interactive web dashboard. Pandas: for handling and cleaning data. Deployed on Plotly Cloud: so the app is accessible via a live public link. Visualization Techniques: Bar charts, line charts, and comparison plots for better insights.
Challenges I ran into
Setting up deployment and making the app live. Debugging Dash callbacks when graphs didn’t update correctly. Handling missing or incomplete datasets without breaking the app. Making sure the interface was simple and user-friendly.
Accomplishments that I proud of
Successfully deployed the app with a live link. Built an interactive tool that can help real-world manufacturing teams. Learned how to integrate data processing, visualization, and web deployment into a single project.
What we learned
How to use Dash + Plotly effectively for interactive dashboards. How to handle real-world messy datasets. Best practices in deployment and app publishing. The importance of visual storytelling in data science.
What's next for Global Happiness Explorer
Add AI/ML predictions for defect detection. Enable role-based access for different teams. Provide an export option (Excel/PDF reports). Expand to other industries beyond manufacturing.

Log in or sign up for Devpost to join the conversation.