Inspiration
With the rise of content creators and the creator economy, YouTube analytics has become an essential tool for making data-driven decisions. Many creators struggle to interpret raw metrics and optimize their content strategy. We were inspired to build an app that turns these numbers into clear, visual insights to empower creators with actionable intelligence.
What it does
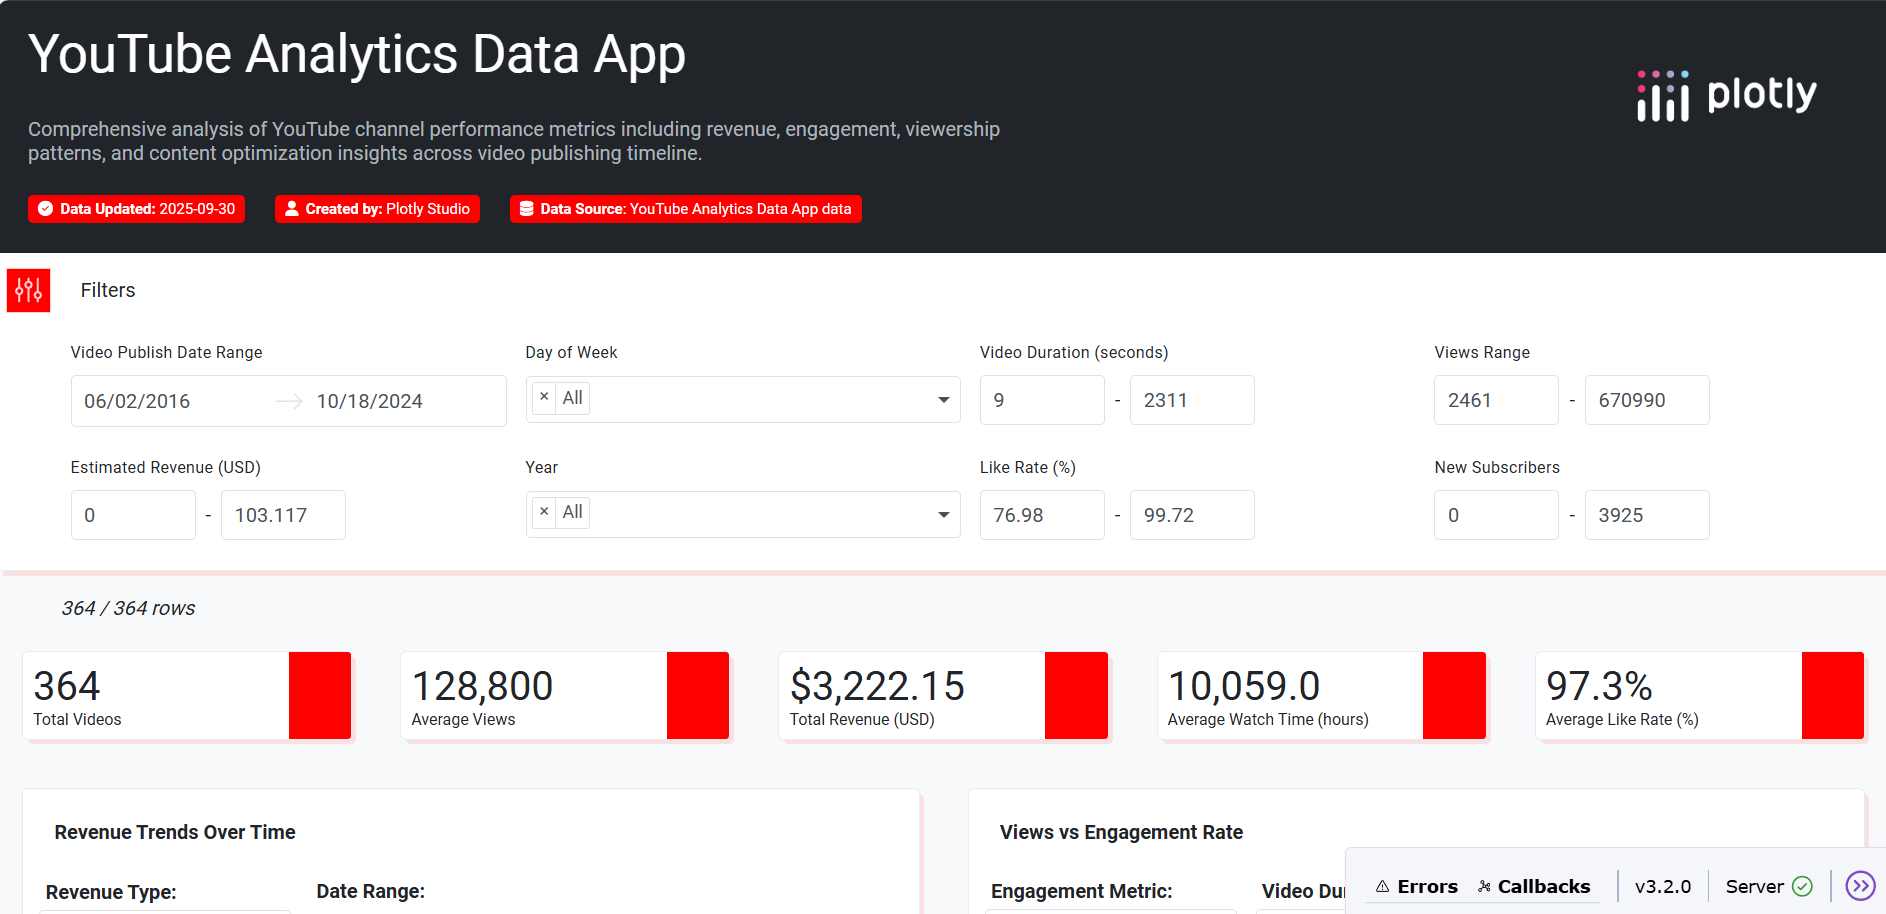
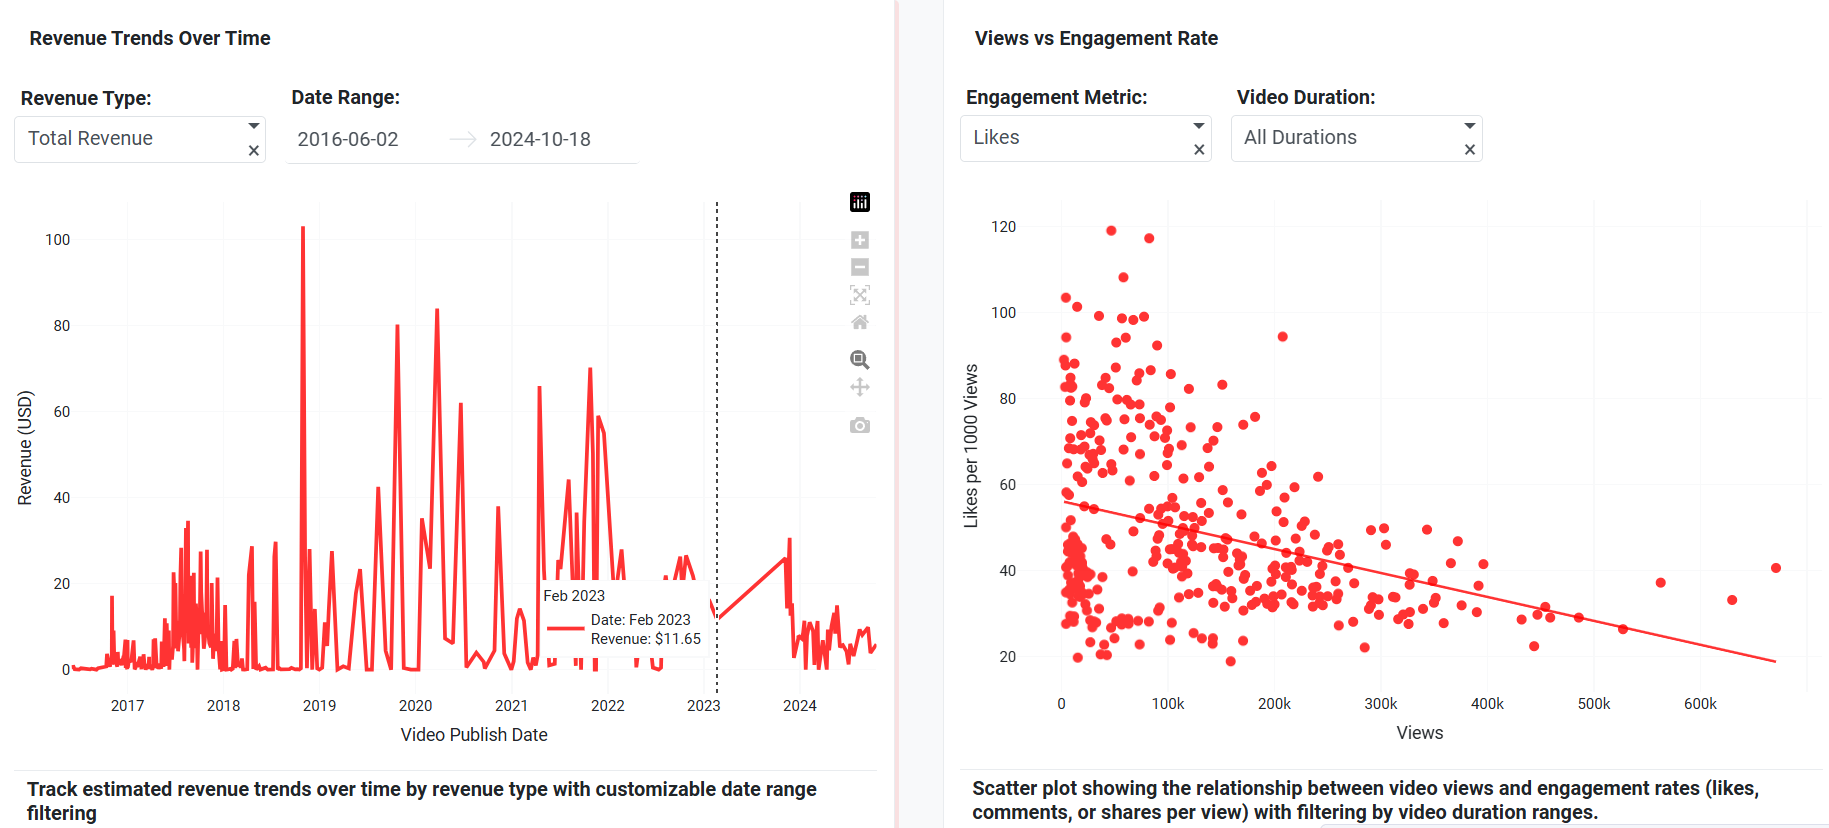
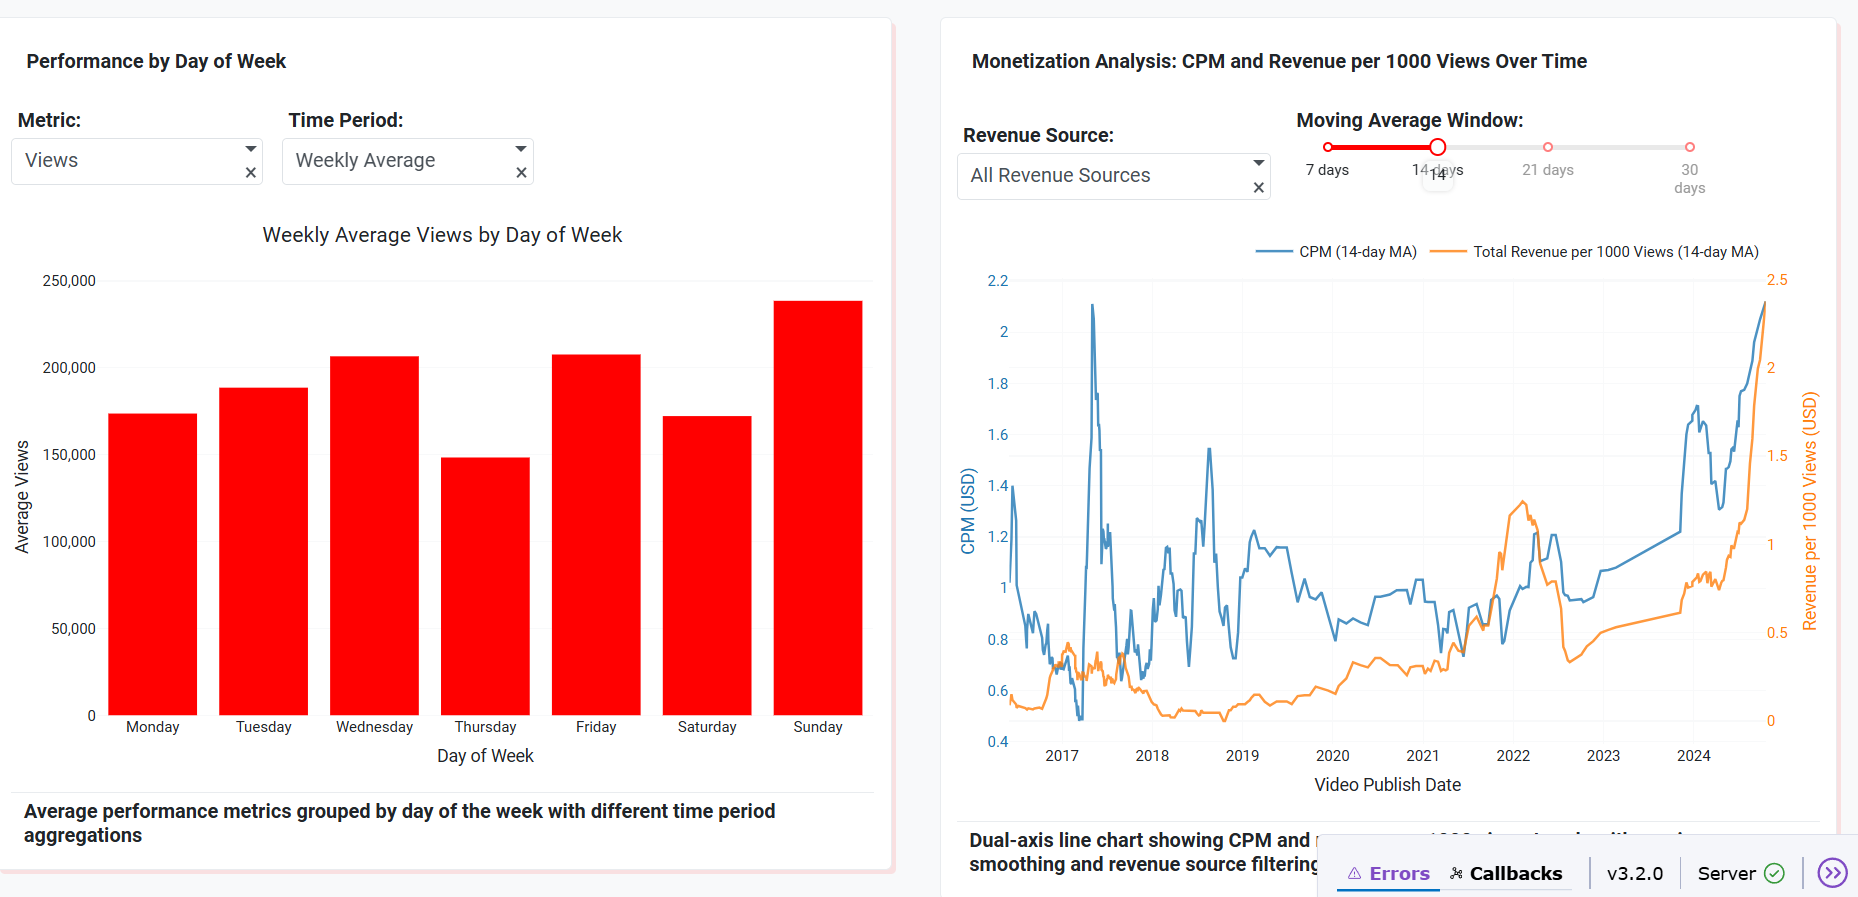
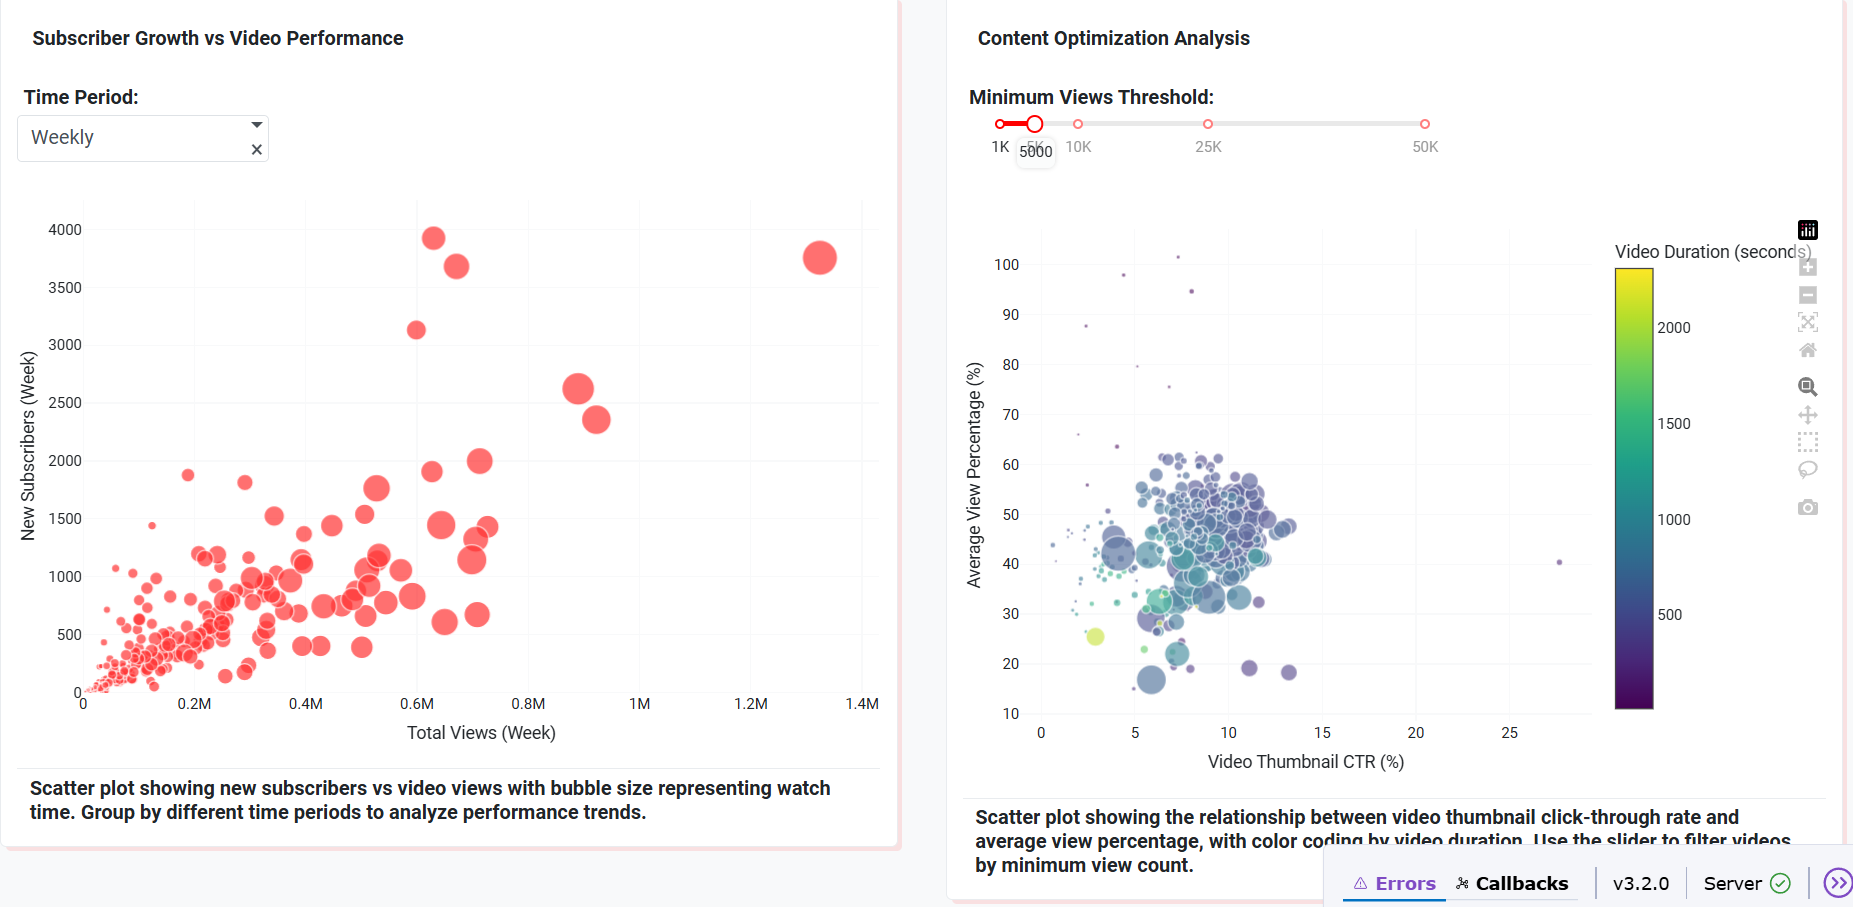
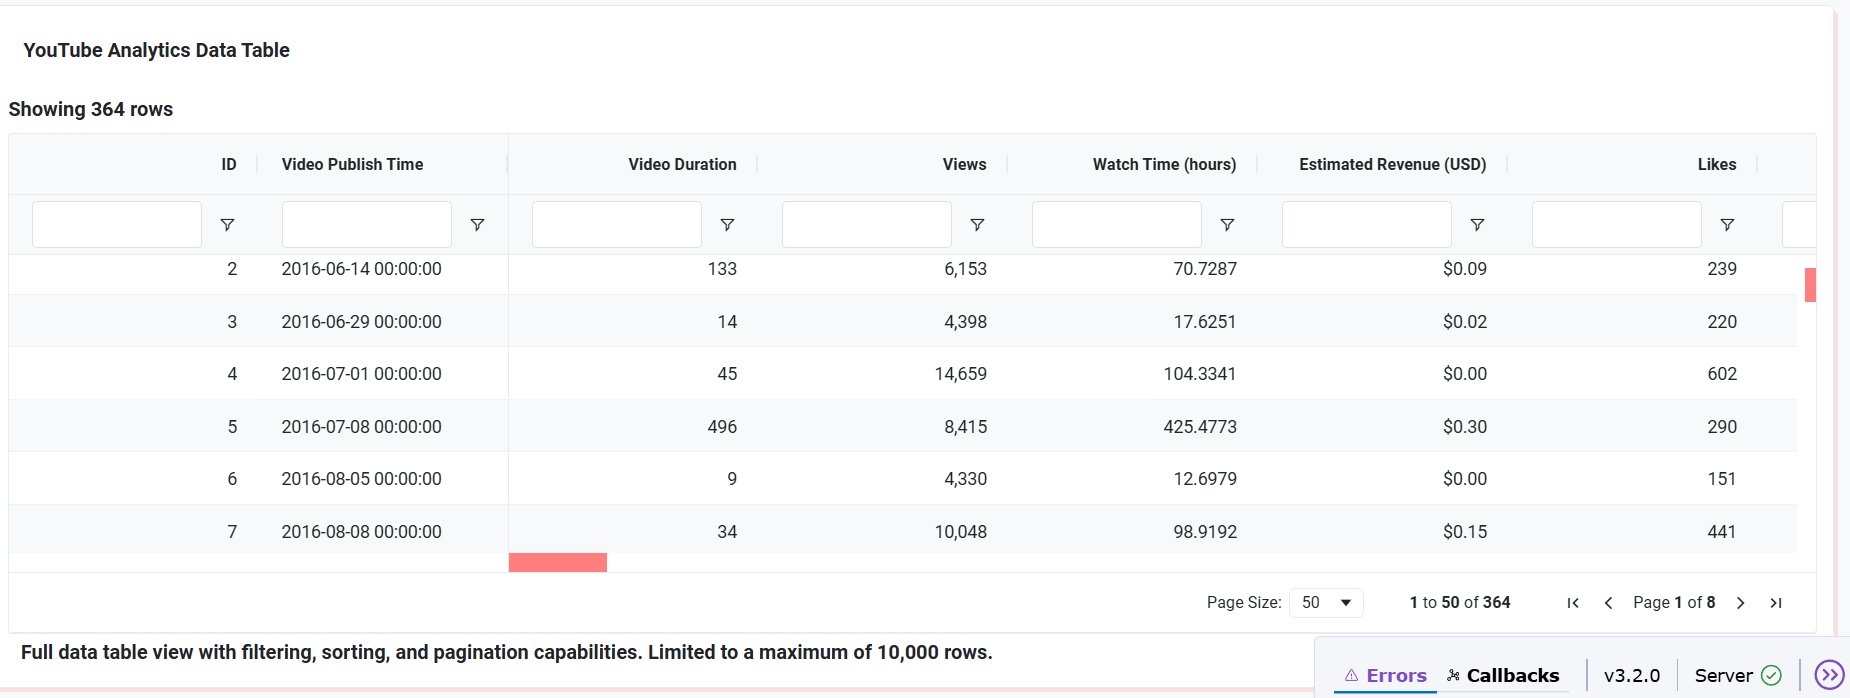
The YouTube Analytics Data App provides an interactive dashboard that helps creators explore their channel performance across multiple dimensions: -> Revenue trends over time -> Viewer engagement and retention analysis -> Subscriber growth patterns -> Insights into click-through rate (CTR), watch time, and video length performance -> Comparative analysis across days, weeks, and years
How we built it
-> Dataset: A curated YouTube analytics dataset containing views, revenue, engagement, and subscriber metrics. -> Tool: Built entirely using Plotly Studio, leveraging AI-assisted app generation. -> Visualizations: Created 6 dynamic charts (line, bar, scatter, bubble, and dual-axis line charts). -> Filters & Controls: Implemented global filters for date range, duration, revenue, likes, and subscribers to make exploration flexible. -> Design: Applied a modern, YouTube-inspired theme with red-white accents for familiarity and readability.
Challenges we ran into
-> Understanding how to structure filters and chart interactions in Plotly Studio as beginners. -> Keeping the app lightweight and responsive while using multiple charts. -> Limited AI tokens in the free Pro plan forced us to focus on quality edits rather than generating multiple apps.
Accomplishments that we're proud of
-> Successfully created a professional-grade analytics dashboard from scratch as beginners. -> Designed 6 interactive charts that cover nearly all dimensions of YouTube growth. -> Deployed and published the app on Plotly Cloud, making it accessible for anyone
What we learned
-> Hands-on experience with Plotly Studio for building no-code/low-code data apps. -> The importance of designing clear global filters to make dashboards user-friendly. -> How to approach storytelling with data in a way that provides actionable insights.
What's next for YouTube Analytics Data App
-> Adding AI-powered recommendations (e.g., suggesting best upload times or video lengths). -> Integrating real YouTube API data for real-time analytics. -> Expanding to multi-platform analytics (Instagram Reels, TikTok, Shorts) for a complete creator toolkit.


Log in or sign up for Devpost to join the conversation.