Devpost
Participate in our public hackathons
Devpost for Teams
Access your company's private hackathons
Grow your developer ecosystem and promote your platform
Drive innovation, collaboration, and retention within your organization
By use case
Blog
Insights into hackathon planning and participation
Customer stories
Inspiration from peers and other industry leaders
Planning guides
Best practices for planning online and in-person hackathons
Webinars & events
Upcoming events and on-demand recordings
Help desk
Common questions and support documentation
Sort by:
Where heat risk meets human care.
Isolation. Immobility. Inaccessibility. Just the tip of the iceberg. Matcha Latte(r) shows outreach teams where the rest is hiding.
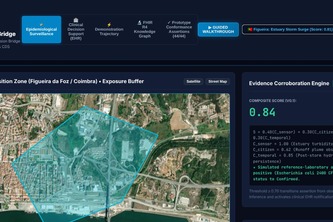
Semantic decision layer bridging aquatic environmental surveillance with hospital EHRs using HL7® FHIR® R4, CDS Hooks 1.0, and SNOMED CT to deliver real-time exposure context.
Field decisions from the JKUAT Conduit climate station, Juja, Kenya.
Some hawker centres are a convenience. Others are a lifeline. When one closes, a gap opens. We show planners who falls into it, where and how many, before it happens.
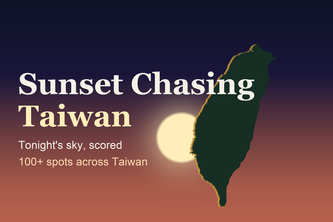
Is tonight's sunset worth the trip? 100+ spots across Taiwan, each scored out of 100 from the forecast at its own sunset hour, with photos, ratings and the last train home.
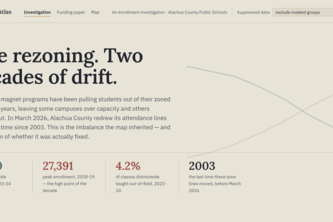
Equity Atlas reveals how enrollment, funding, staffing, and school choice shape opportunity across Alachua County—making inequities visible and helping East Gainesville advocate for change.
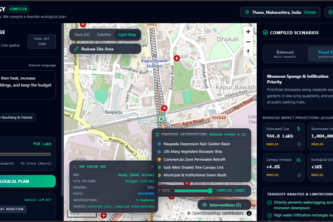
An AI-powered urban ecology compiler that transforms real-world geospatial data and city goals into optimized, visual plans for greener, cooler, more resilient cities.
Verta — From 2D Plans to 3D Property Intelligence.
GroundTruth turns building photos and an address into an editable, map-linked 3D scene for games, GIS, and disaster response.
Turning open data into smarter bin placement and less contamination for Singapore.
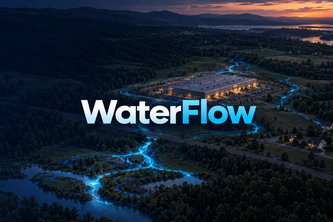
WaterFlow shows where water goes, highlights flood exposure, and turns the data into clear reports.
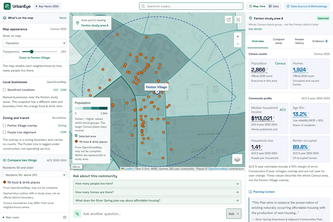
UrbanEye transforms fragmented public data and civic documents into an interactive map. Our verifiable AI delivers transparent, source-backed business insights to drive smarter community development.
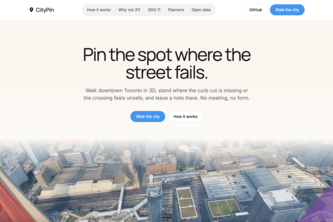
Public consultation you can walk through. Pin what's broken in a real 3D Toronto, upvote what your neighbours found, and hand planners a ranked, GIS-ready map.
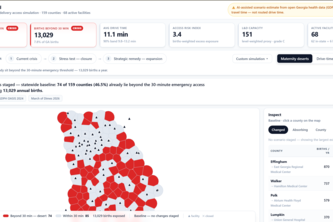
MaternalGrid turns maternity service decisions from a facility cost conversation into a women and births access decision.
A city-sized social game. Residents post photos, AI reads what the neighbourhood feels like, the 3D city rebuilds itself, and city staff get the same data as a live feed.
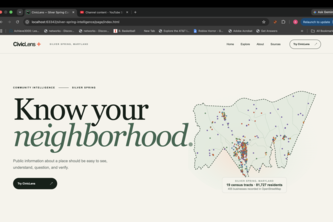
Public data is everywhere. Understanding it shouldn't be. CivicLens is an application we developed used to consolidate all the scattered public records of Silver Spring into one coherent place.
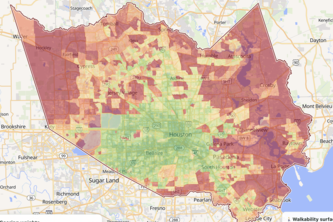
Every map shows you the fastest way to the stadium. We show you the one with shade. Built from real Houston routes, real heat data, and a 1,000-trip simulation that finds the best and the worst route.
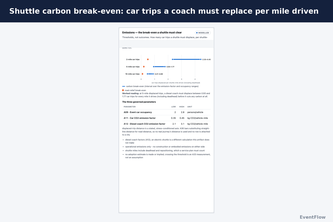
How many extra trains does it take to get 60,000 fans home? Now you can know before kickoff.
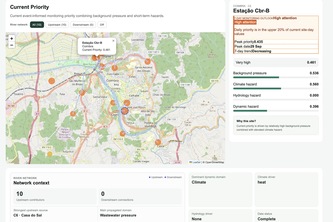
A network-aware freshwater resilience dashboard that turns weather, river flow, ecological context, and field observations into interpretable monitoring priorities and 7-day outlooks.
Turning neighborhood reports into accountable city action.
A sailing circumnavigation on a live map: the boat glides, official sources speak when they matter, and Nemotron on Nebius tells the story of the voyage without ever inventing a number.
An AI-powered urban heat resilience platform combining real-world environmental data, transit corridors, and climate interventions to help cities protect people from extreme heat during FIFA 2026.”
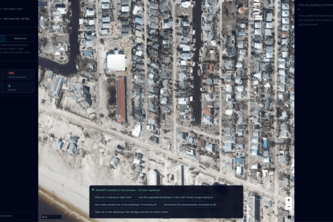
Post-disaster damage assessment where the agent's tools are scoped to what's on your screen. Ask "what's the flood exposure here?" and here means your viewport, your selected building, right now.