-
-
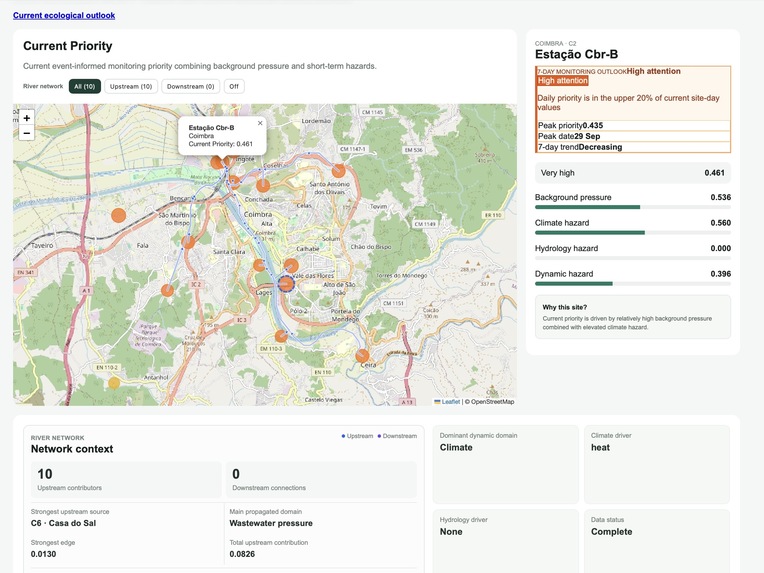
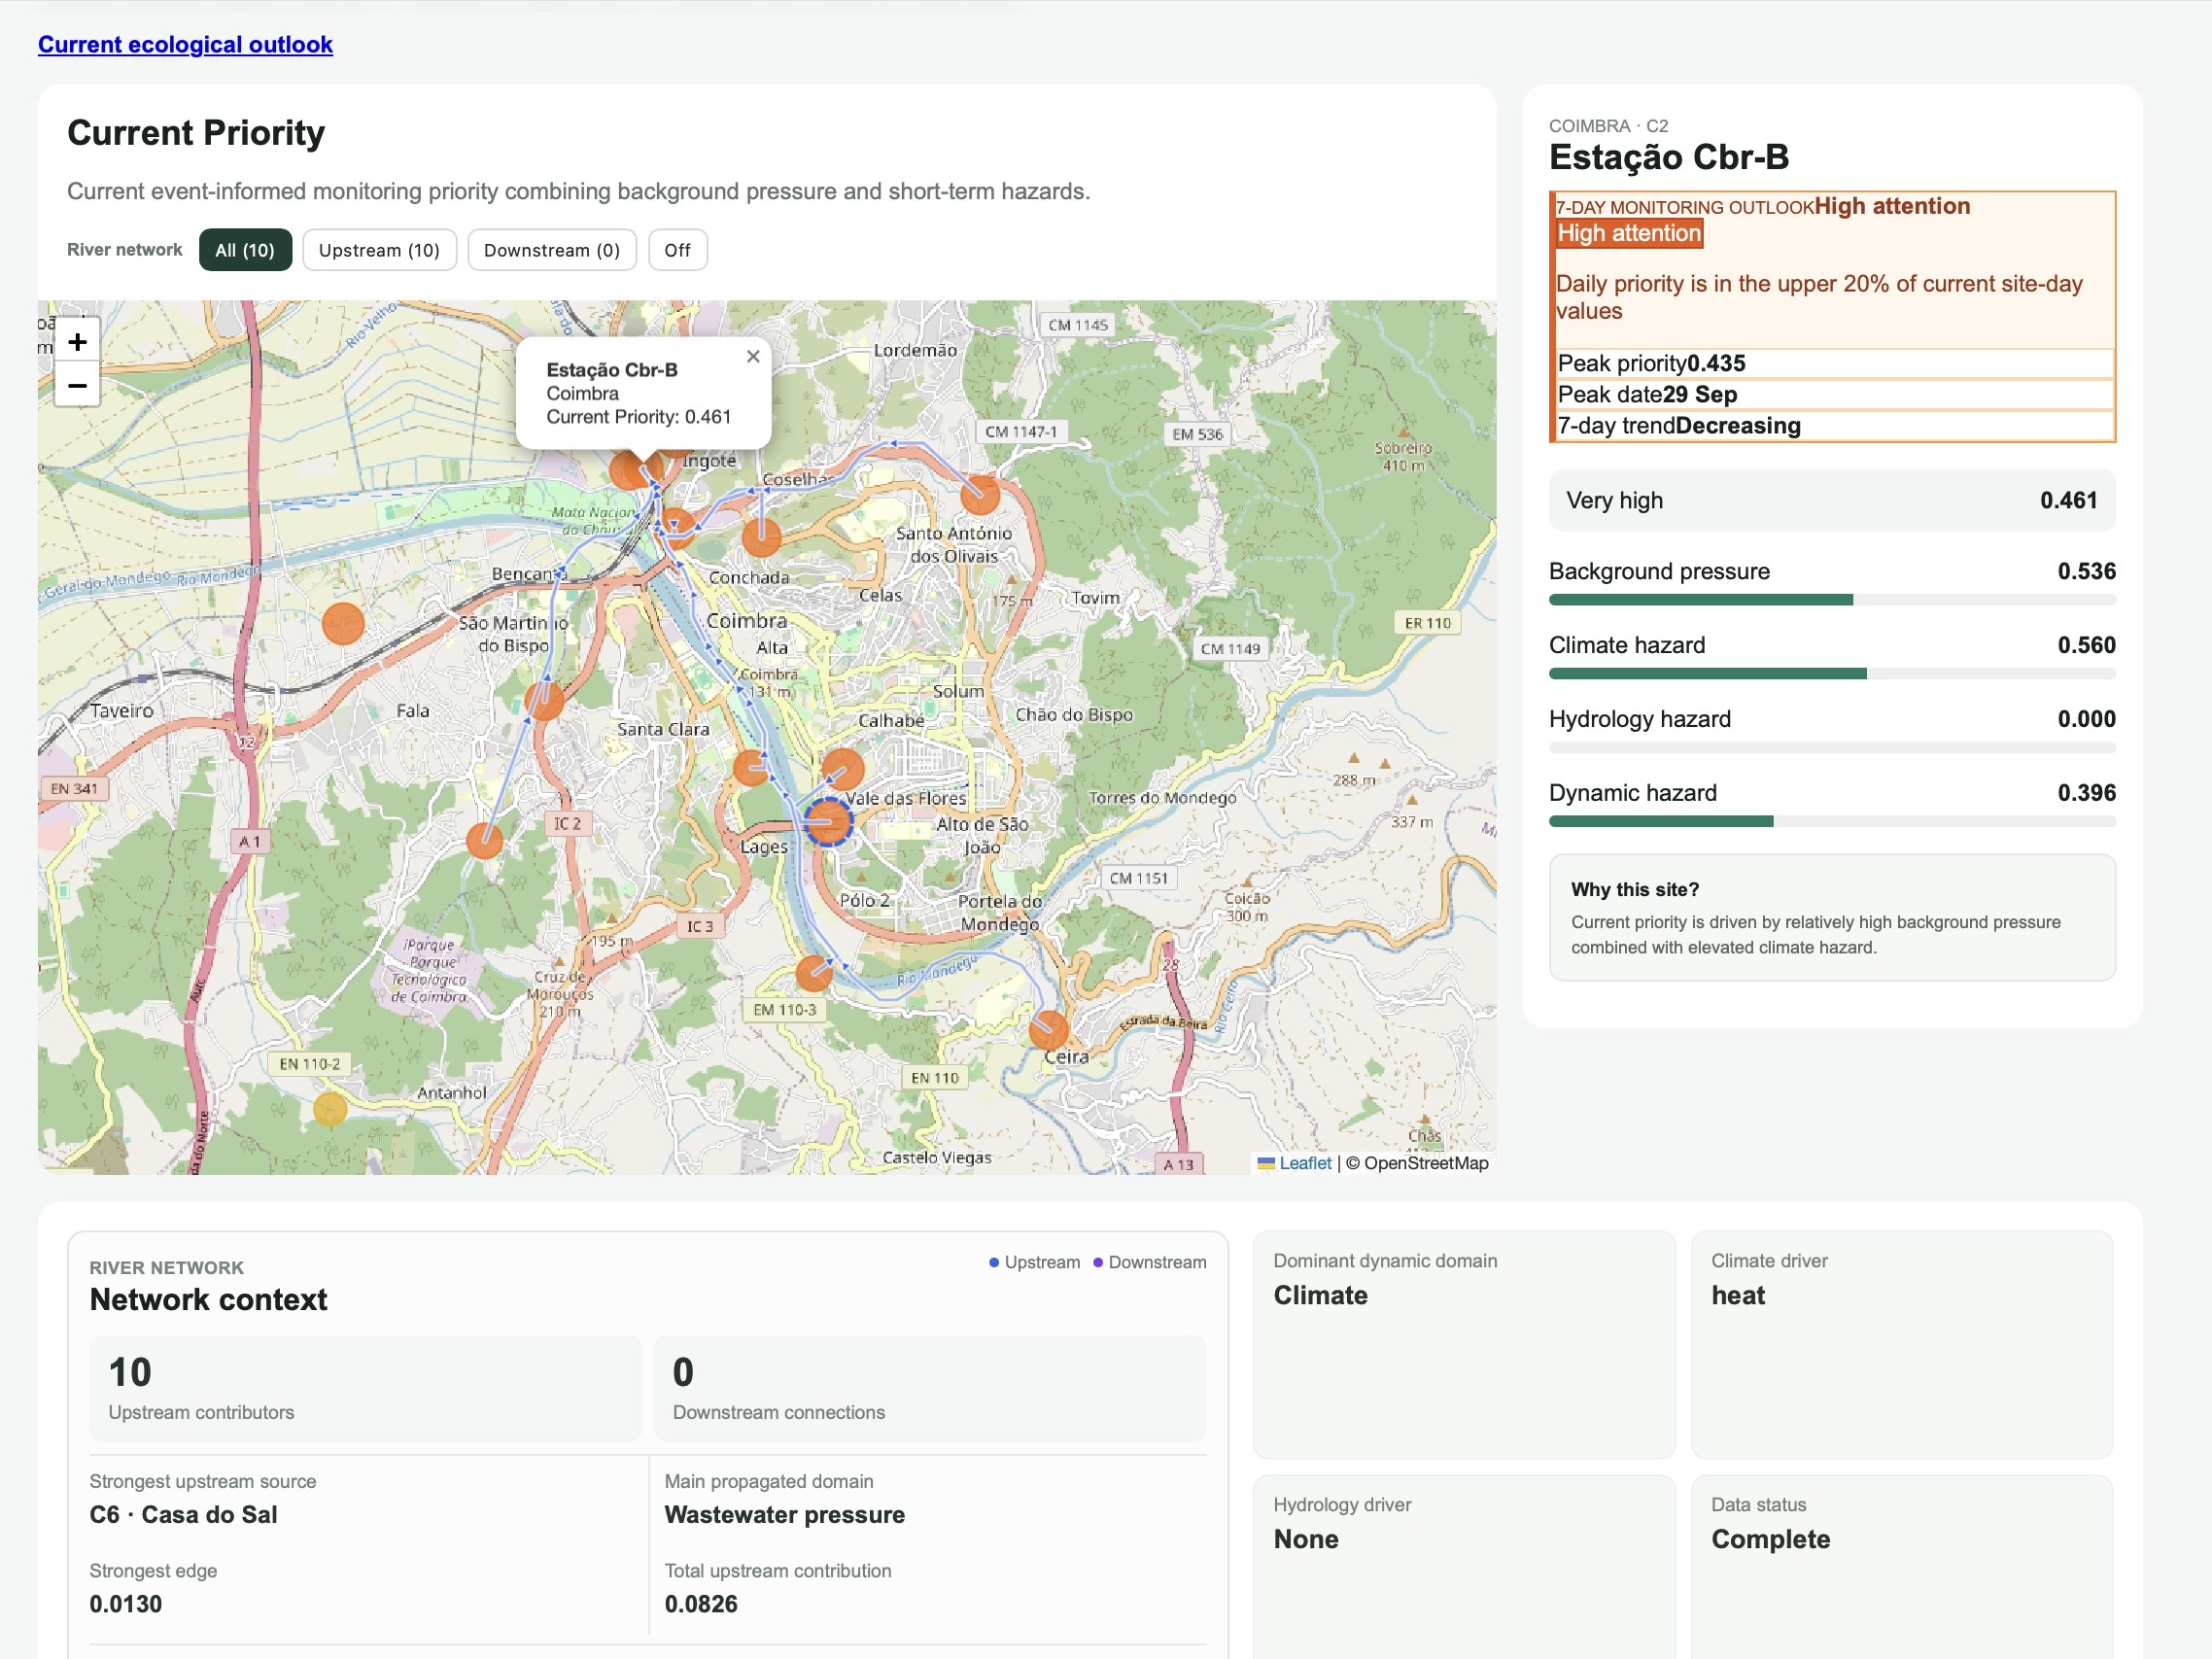
River network / upstream-downstream context
-
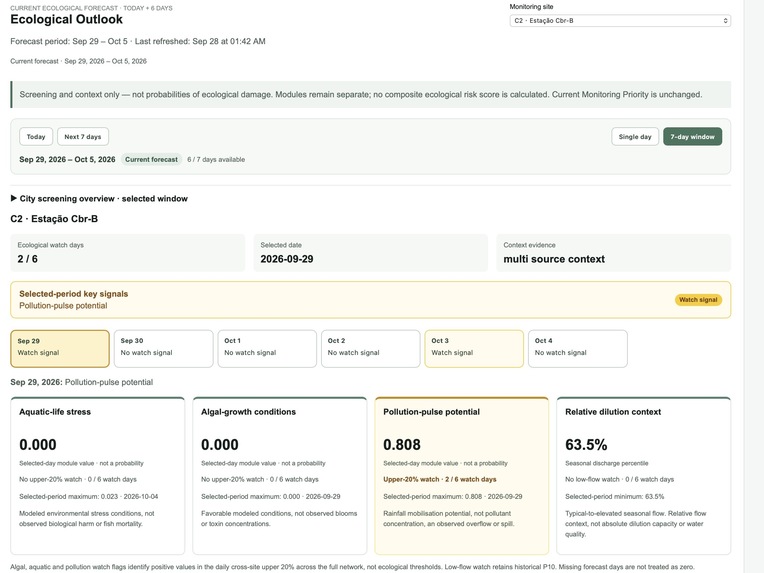
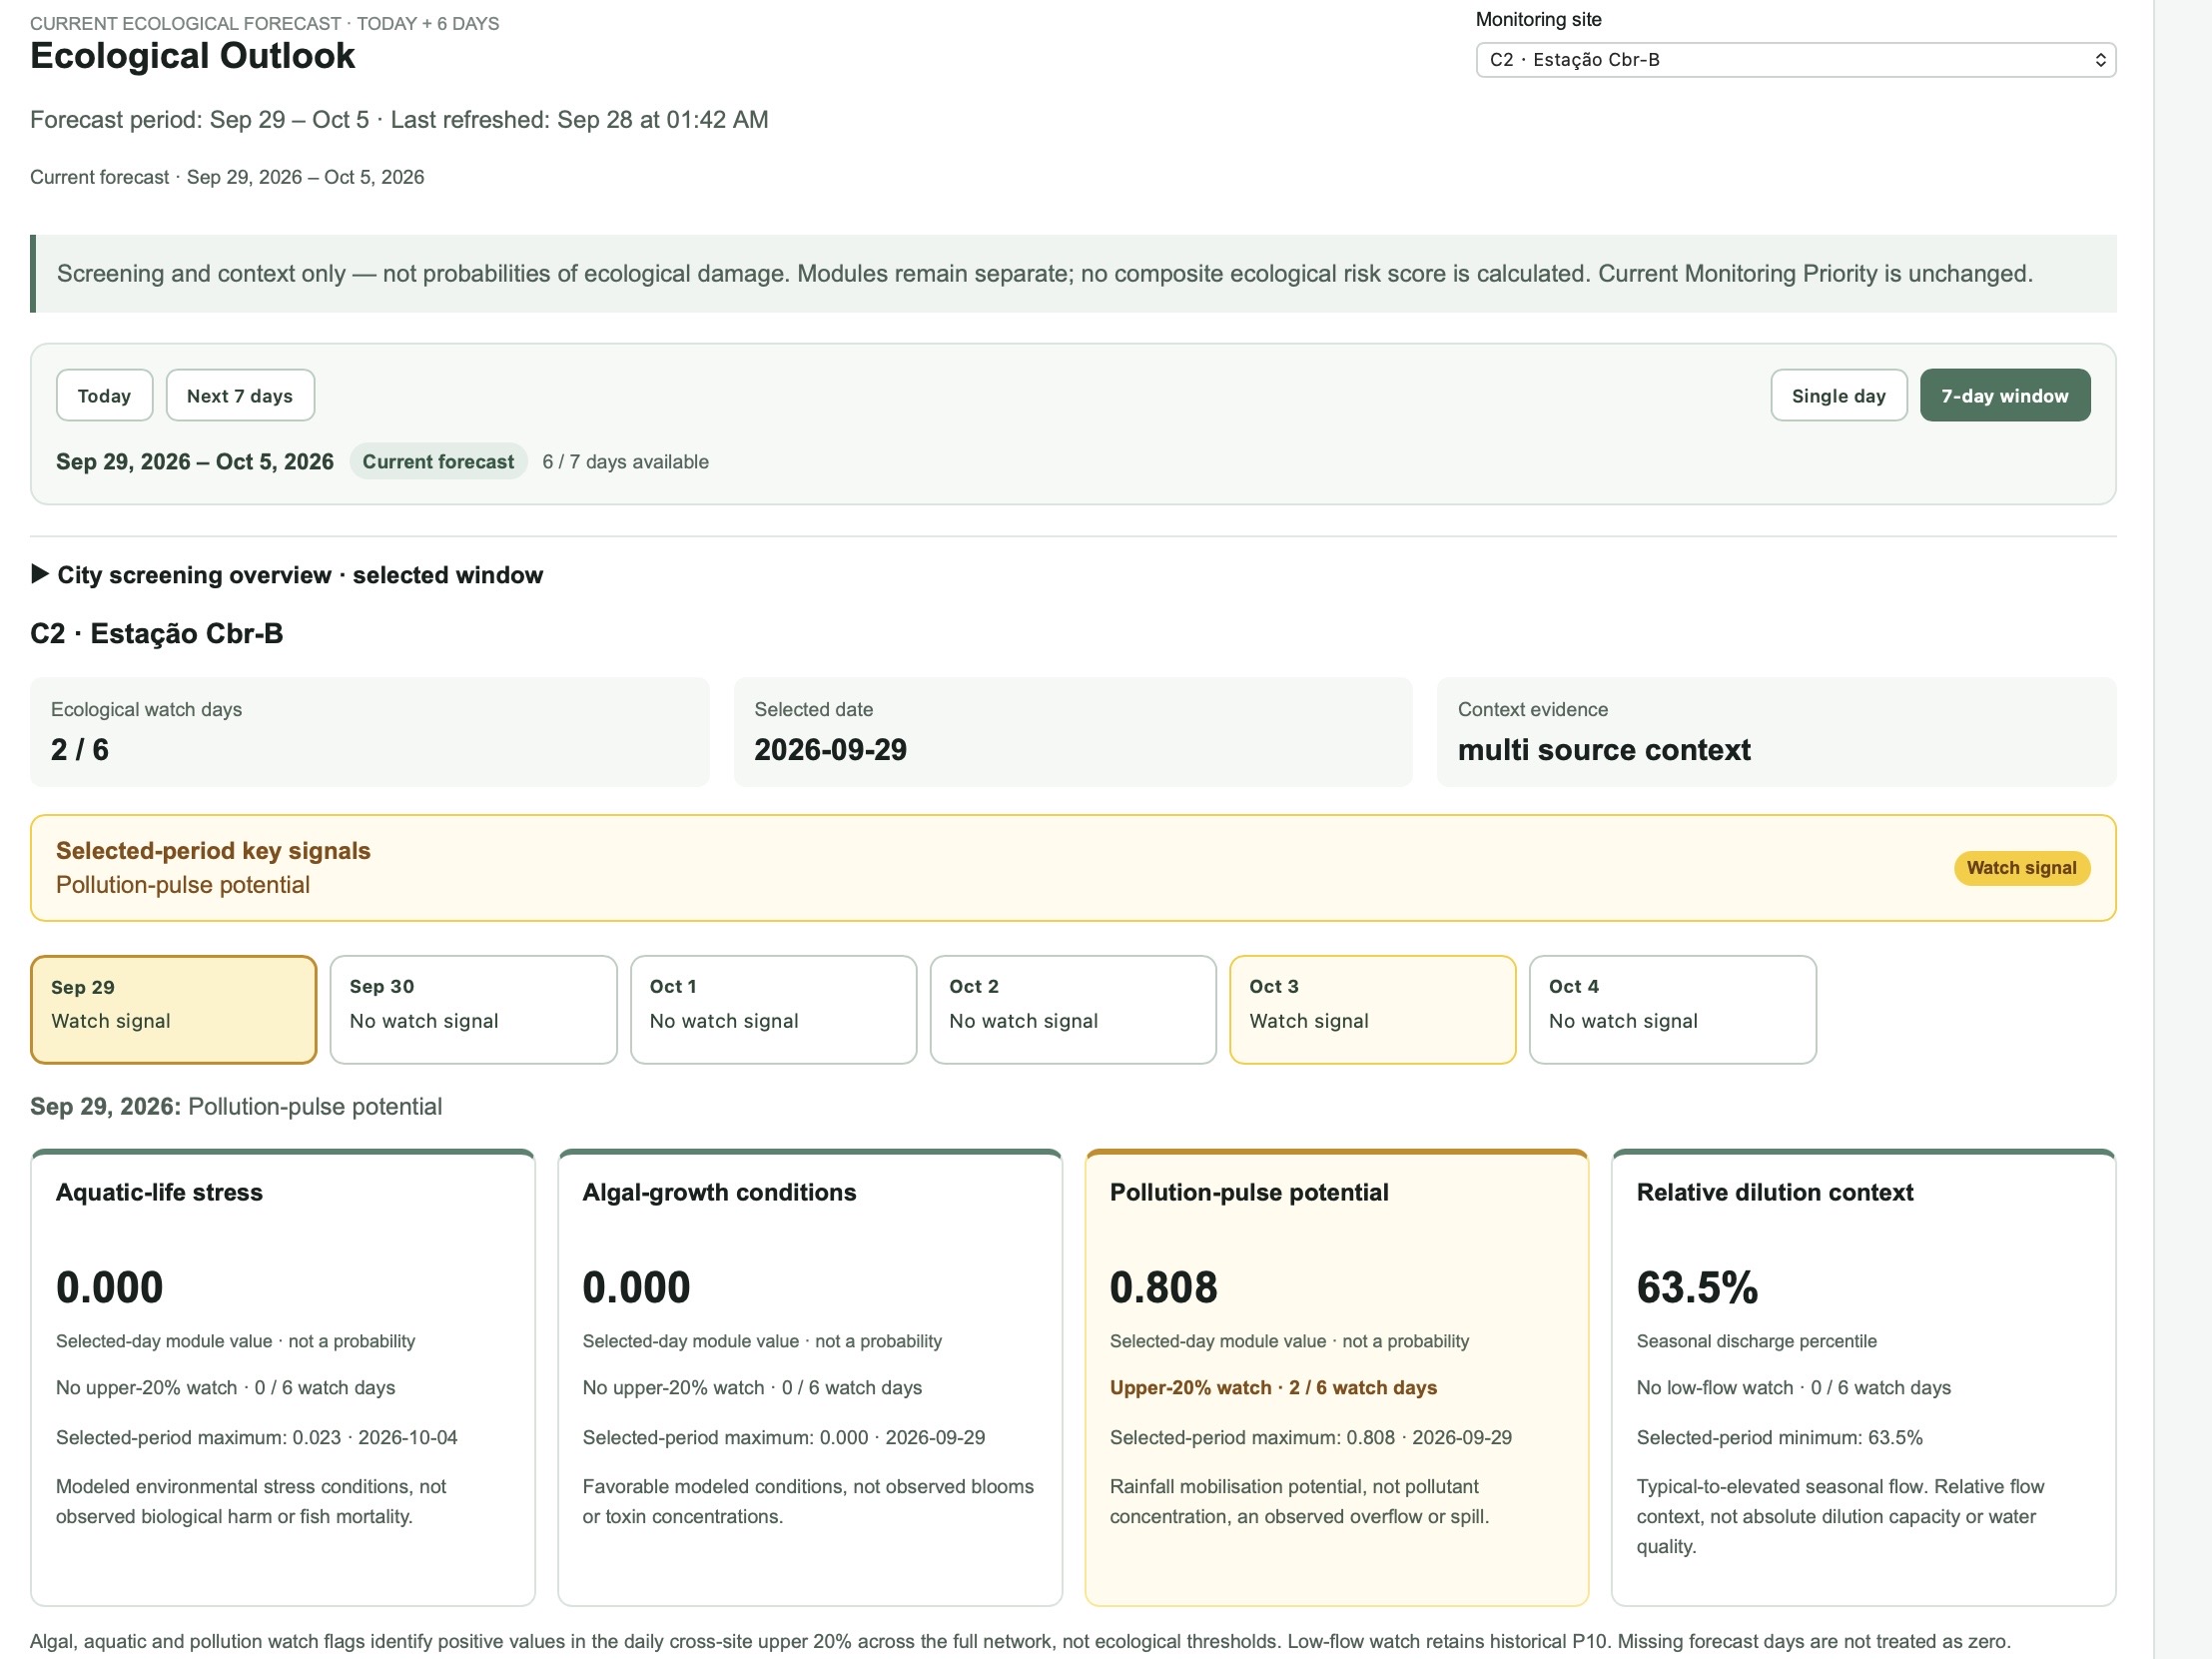
Ecological Outlook
-
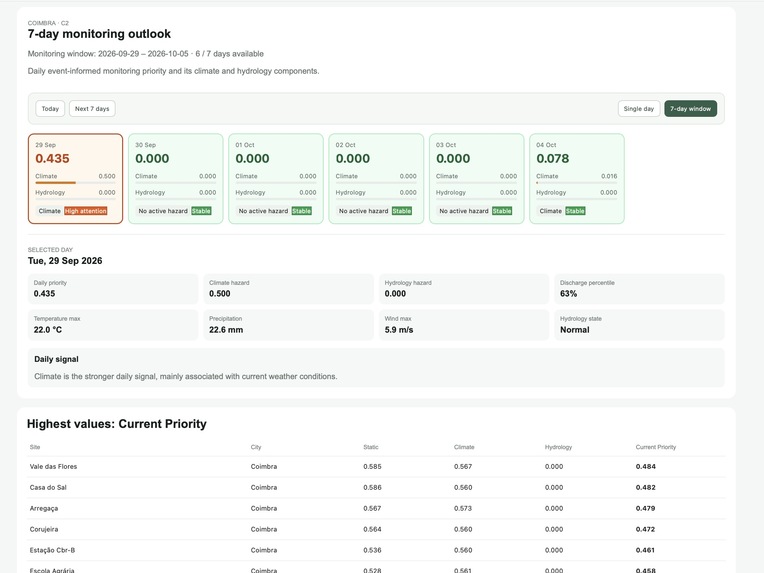
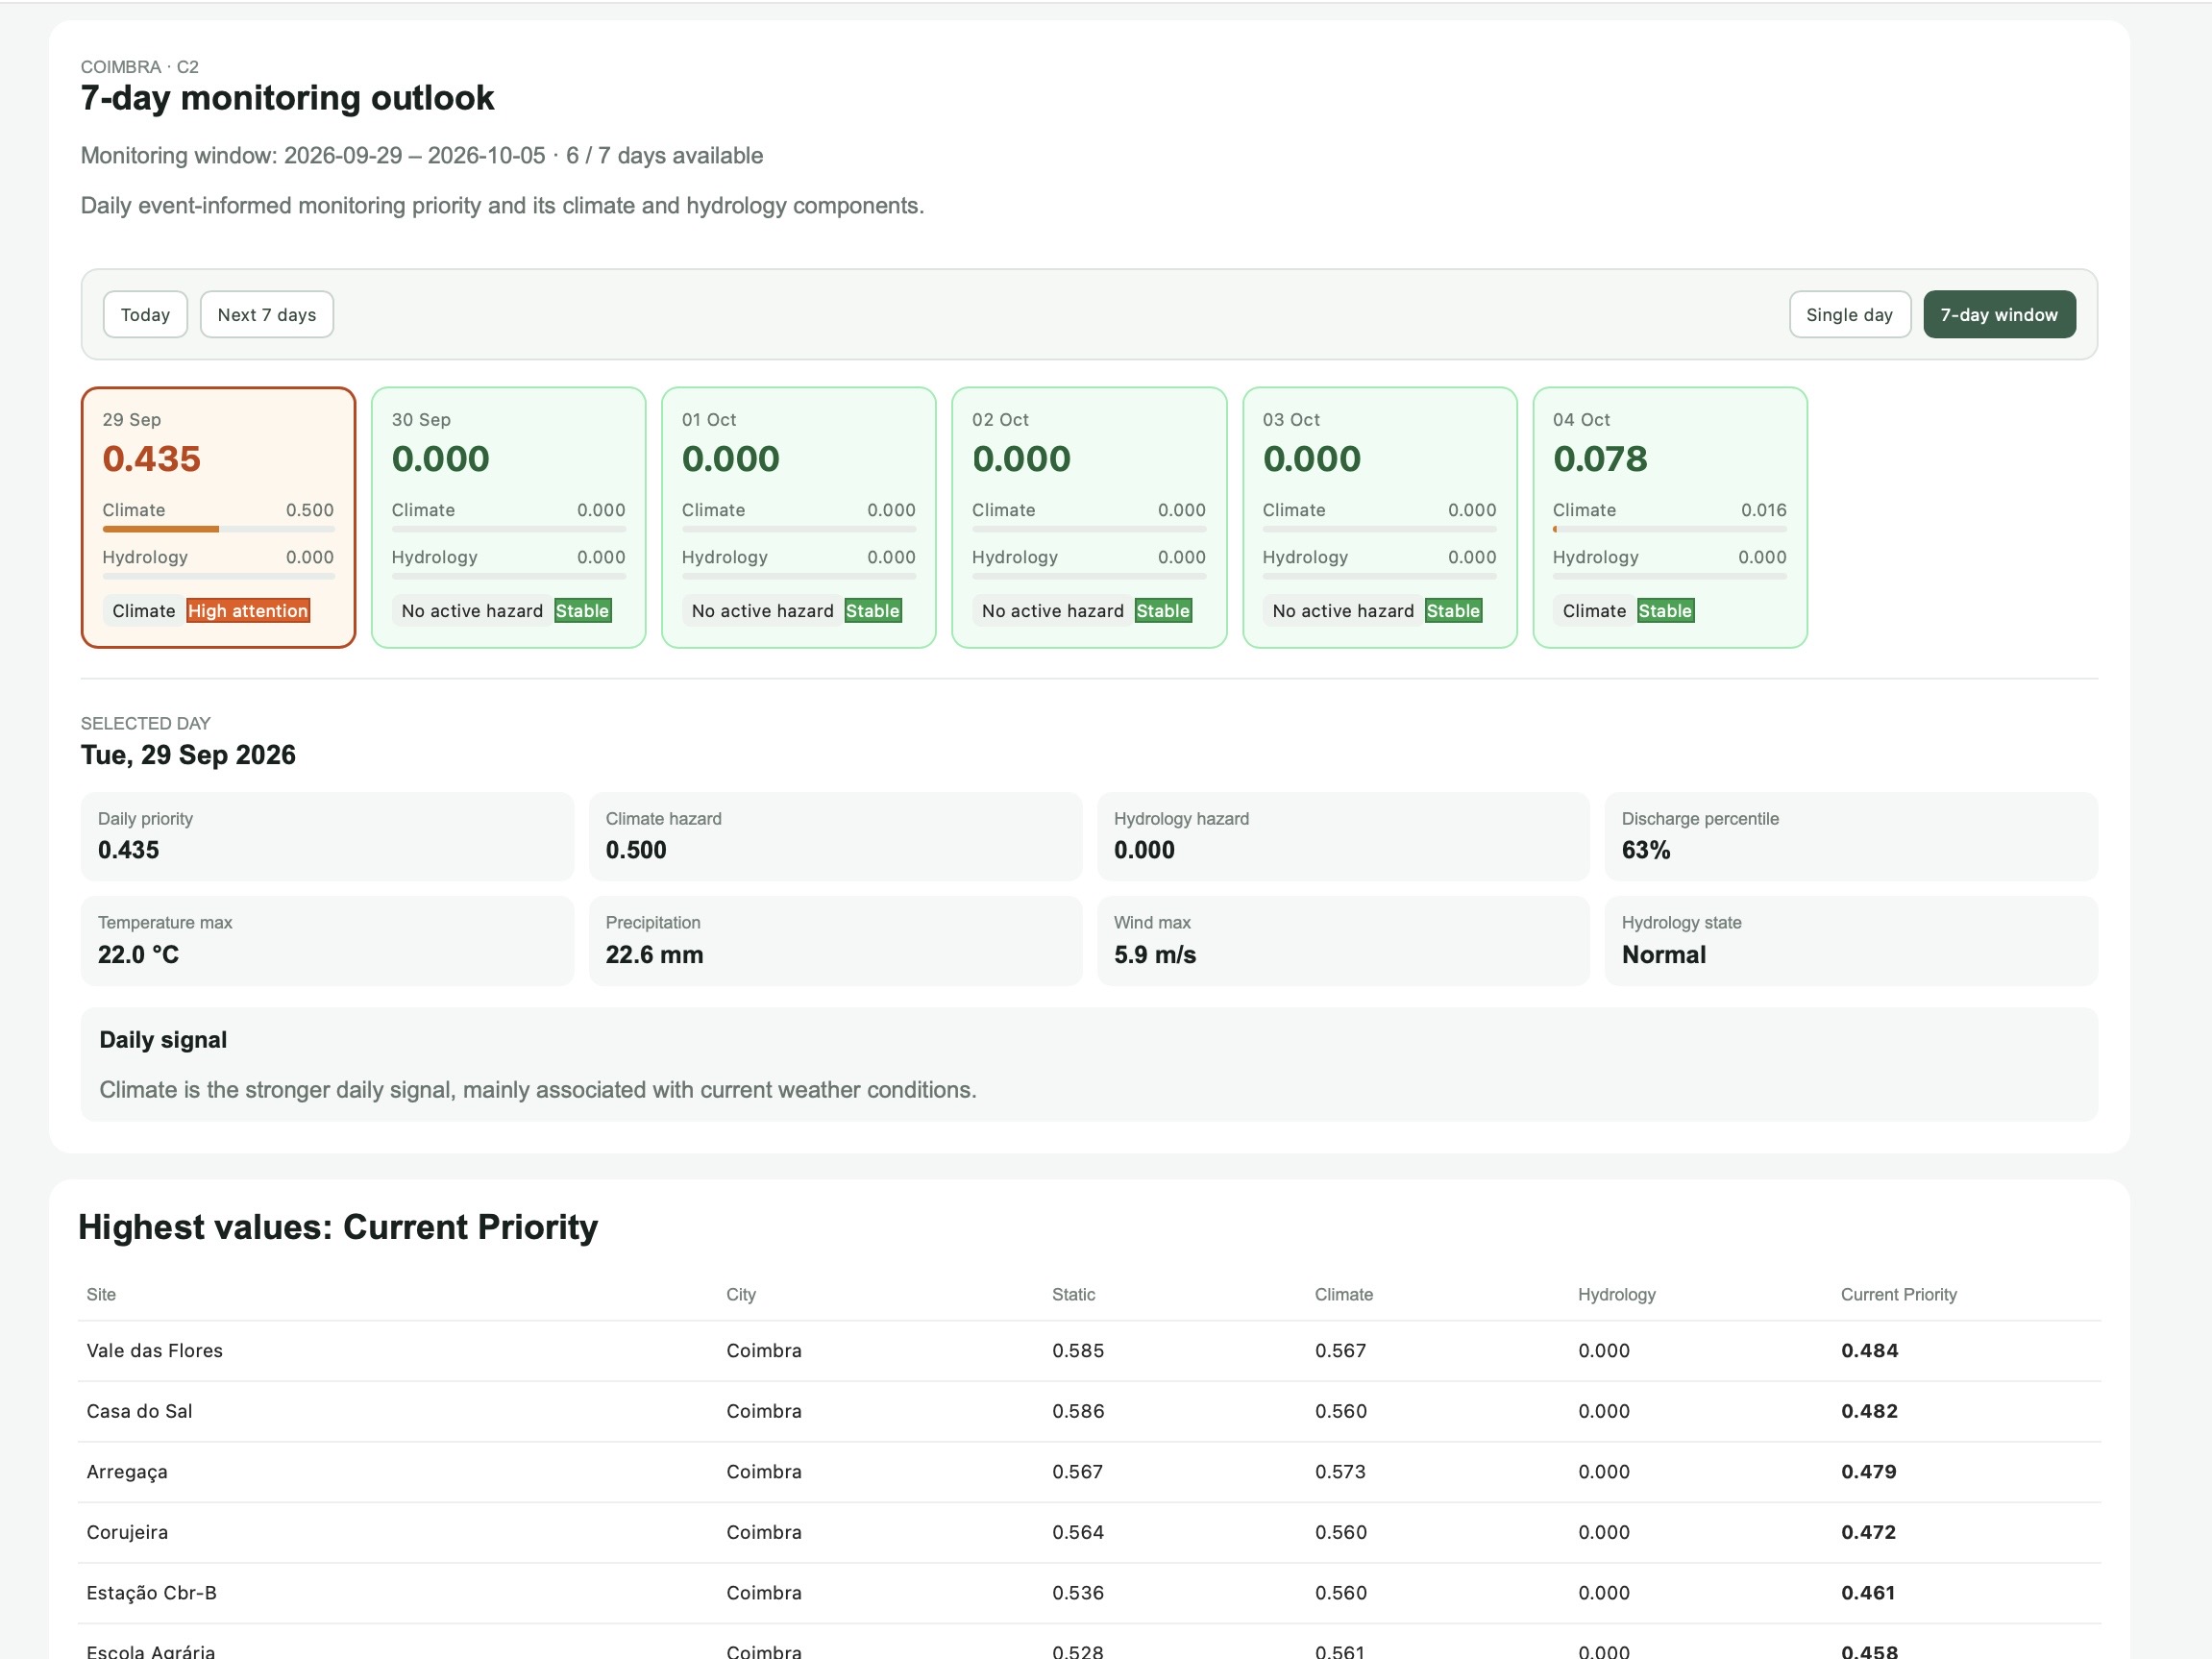
7-day monitoring outlook
-
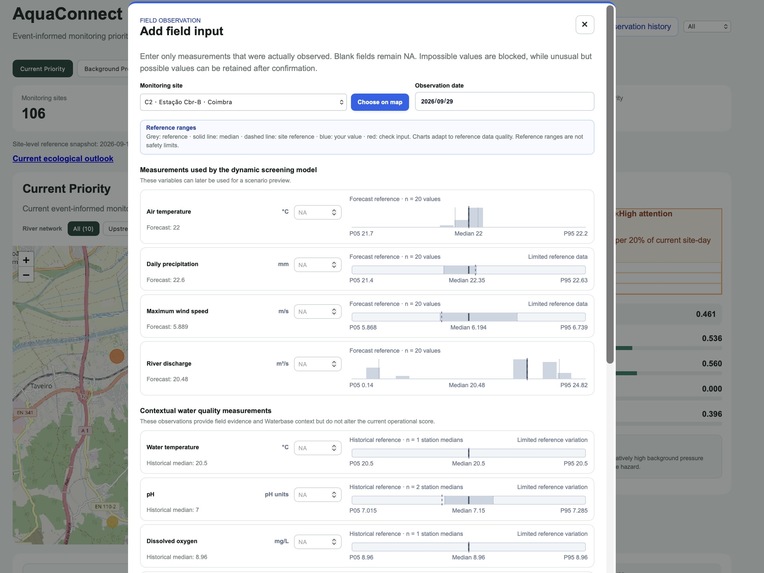
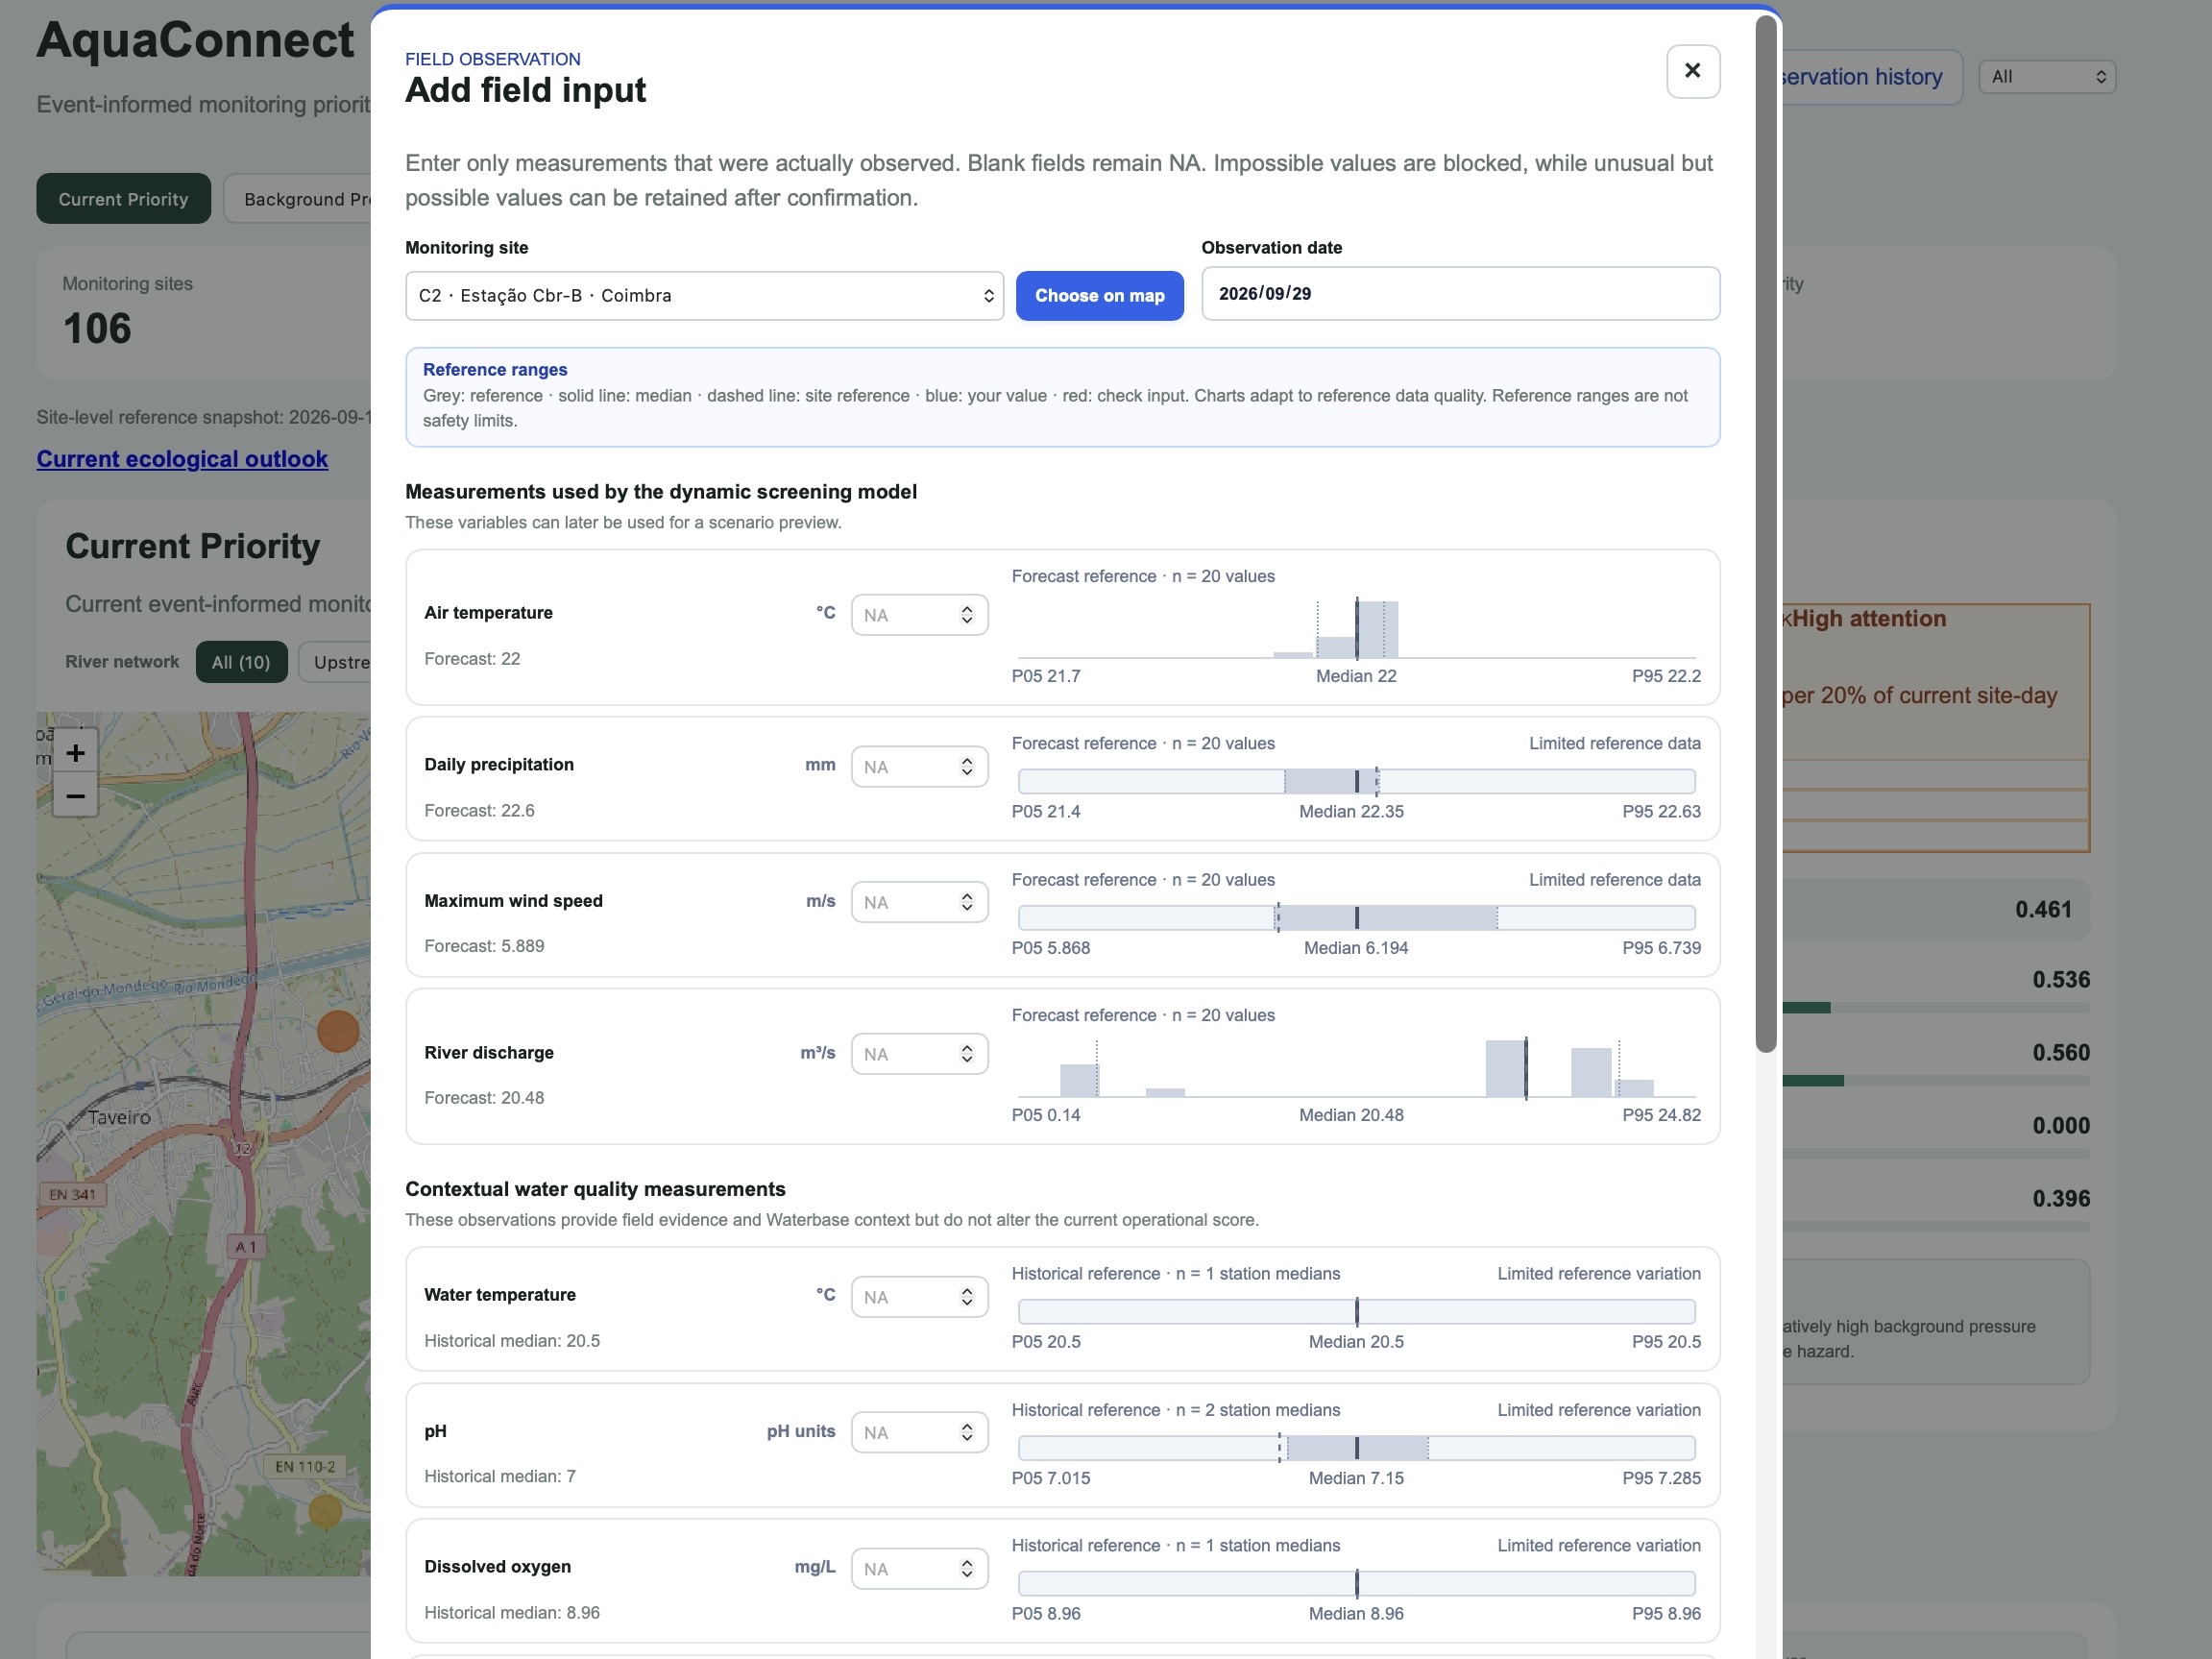
Field Input + Field evidence
-
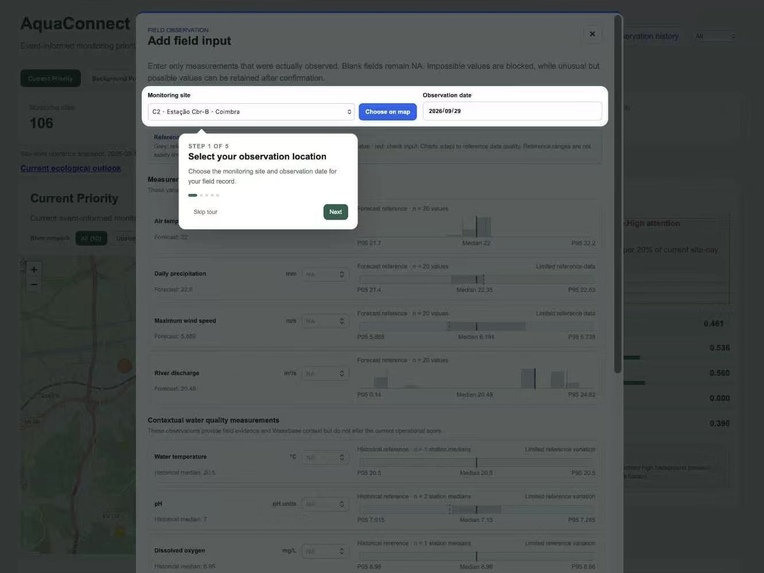
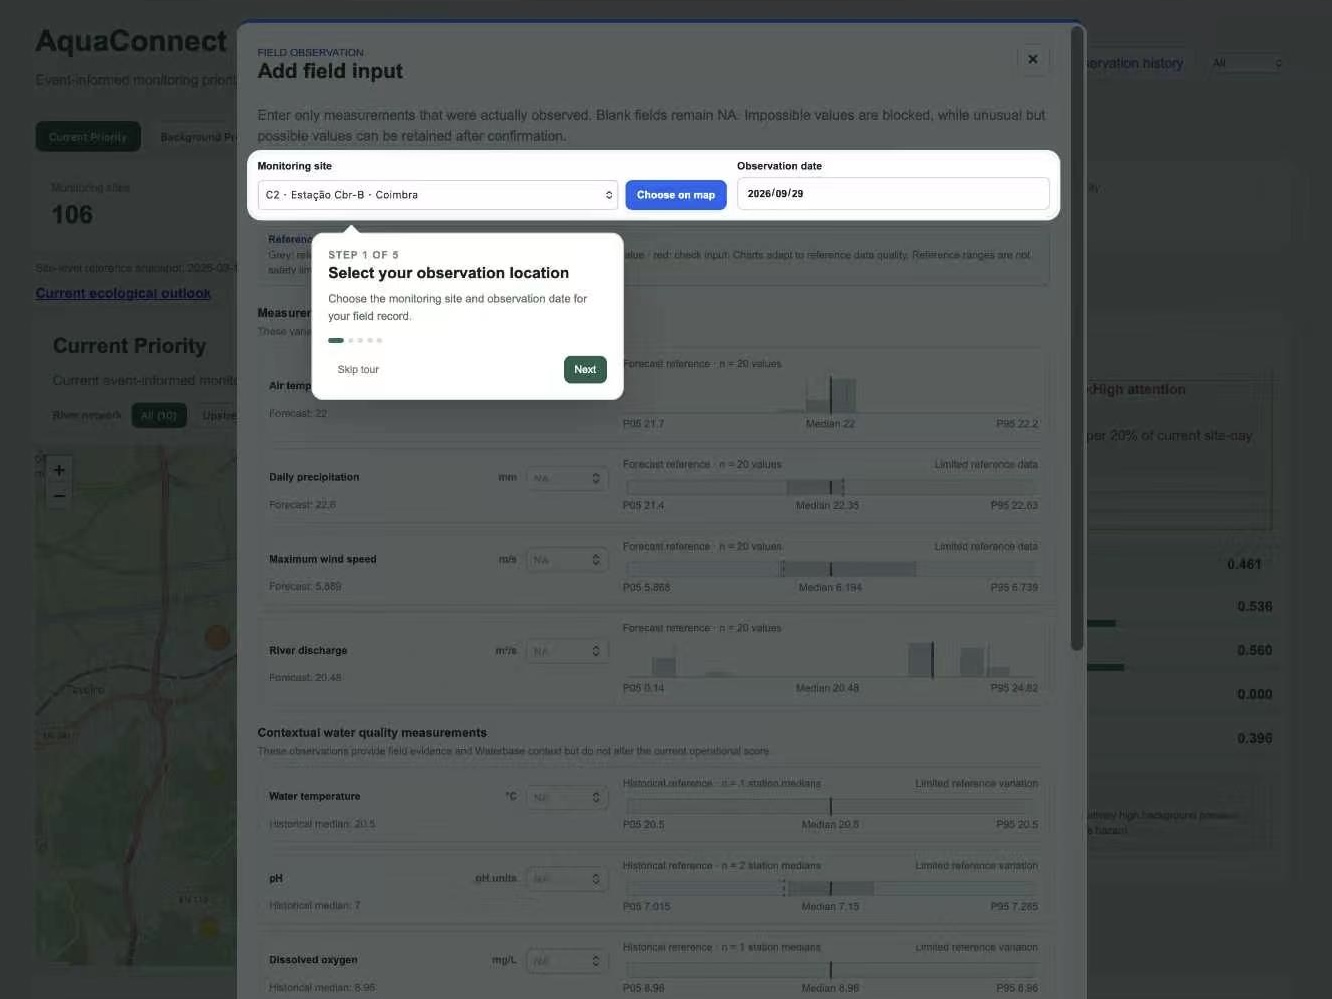
Guide of Field Input
-
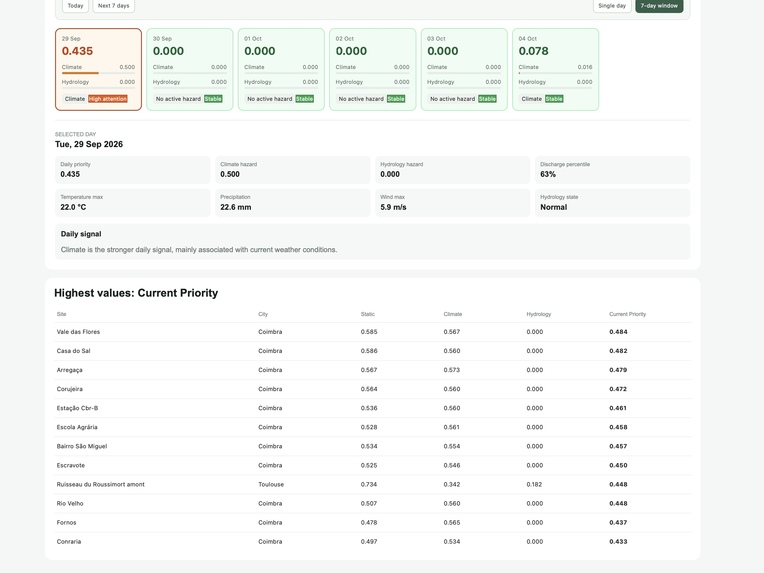
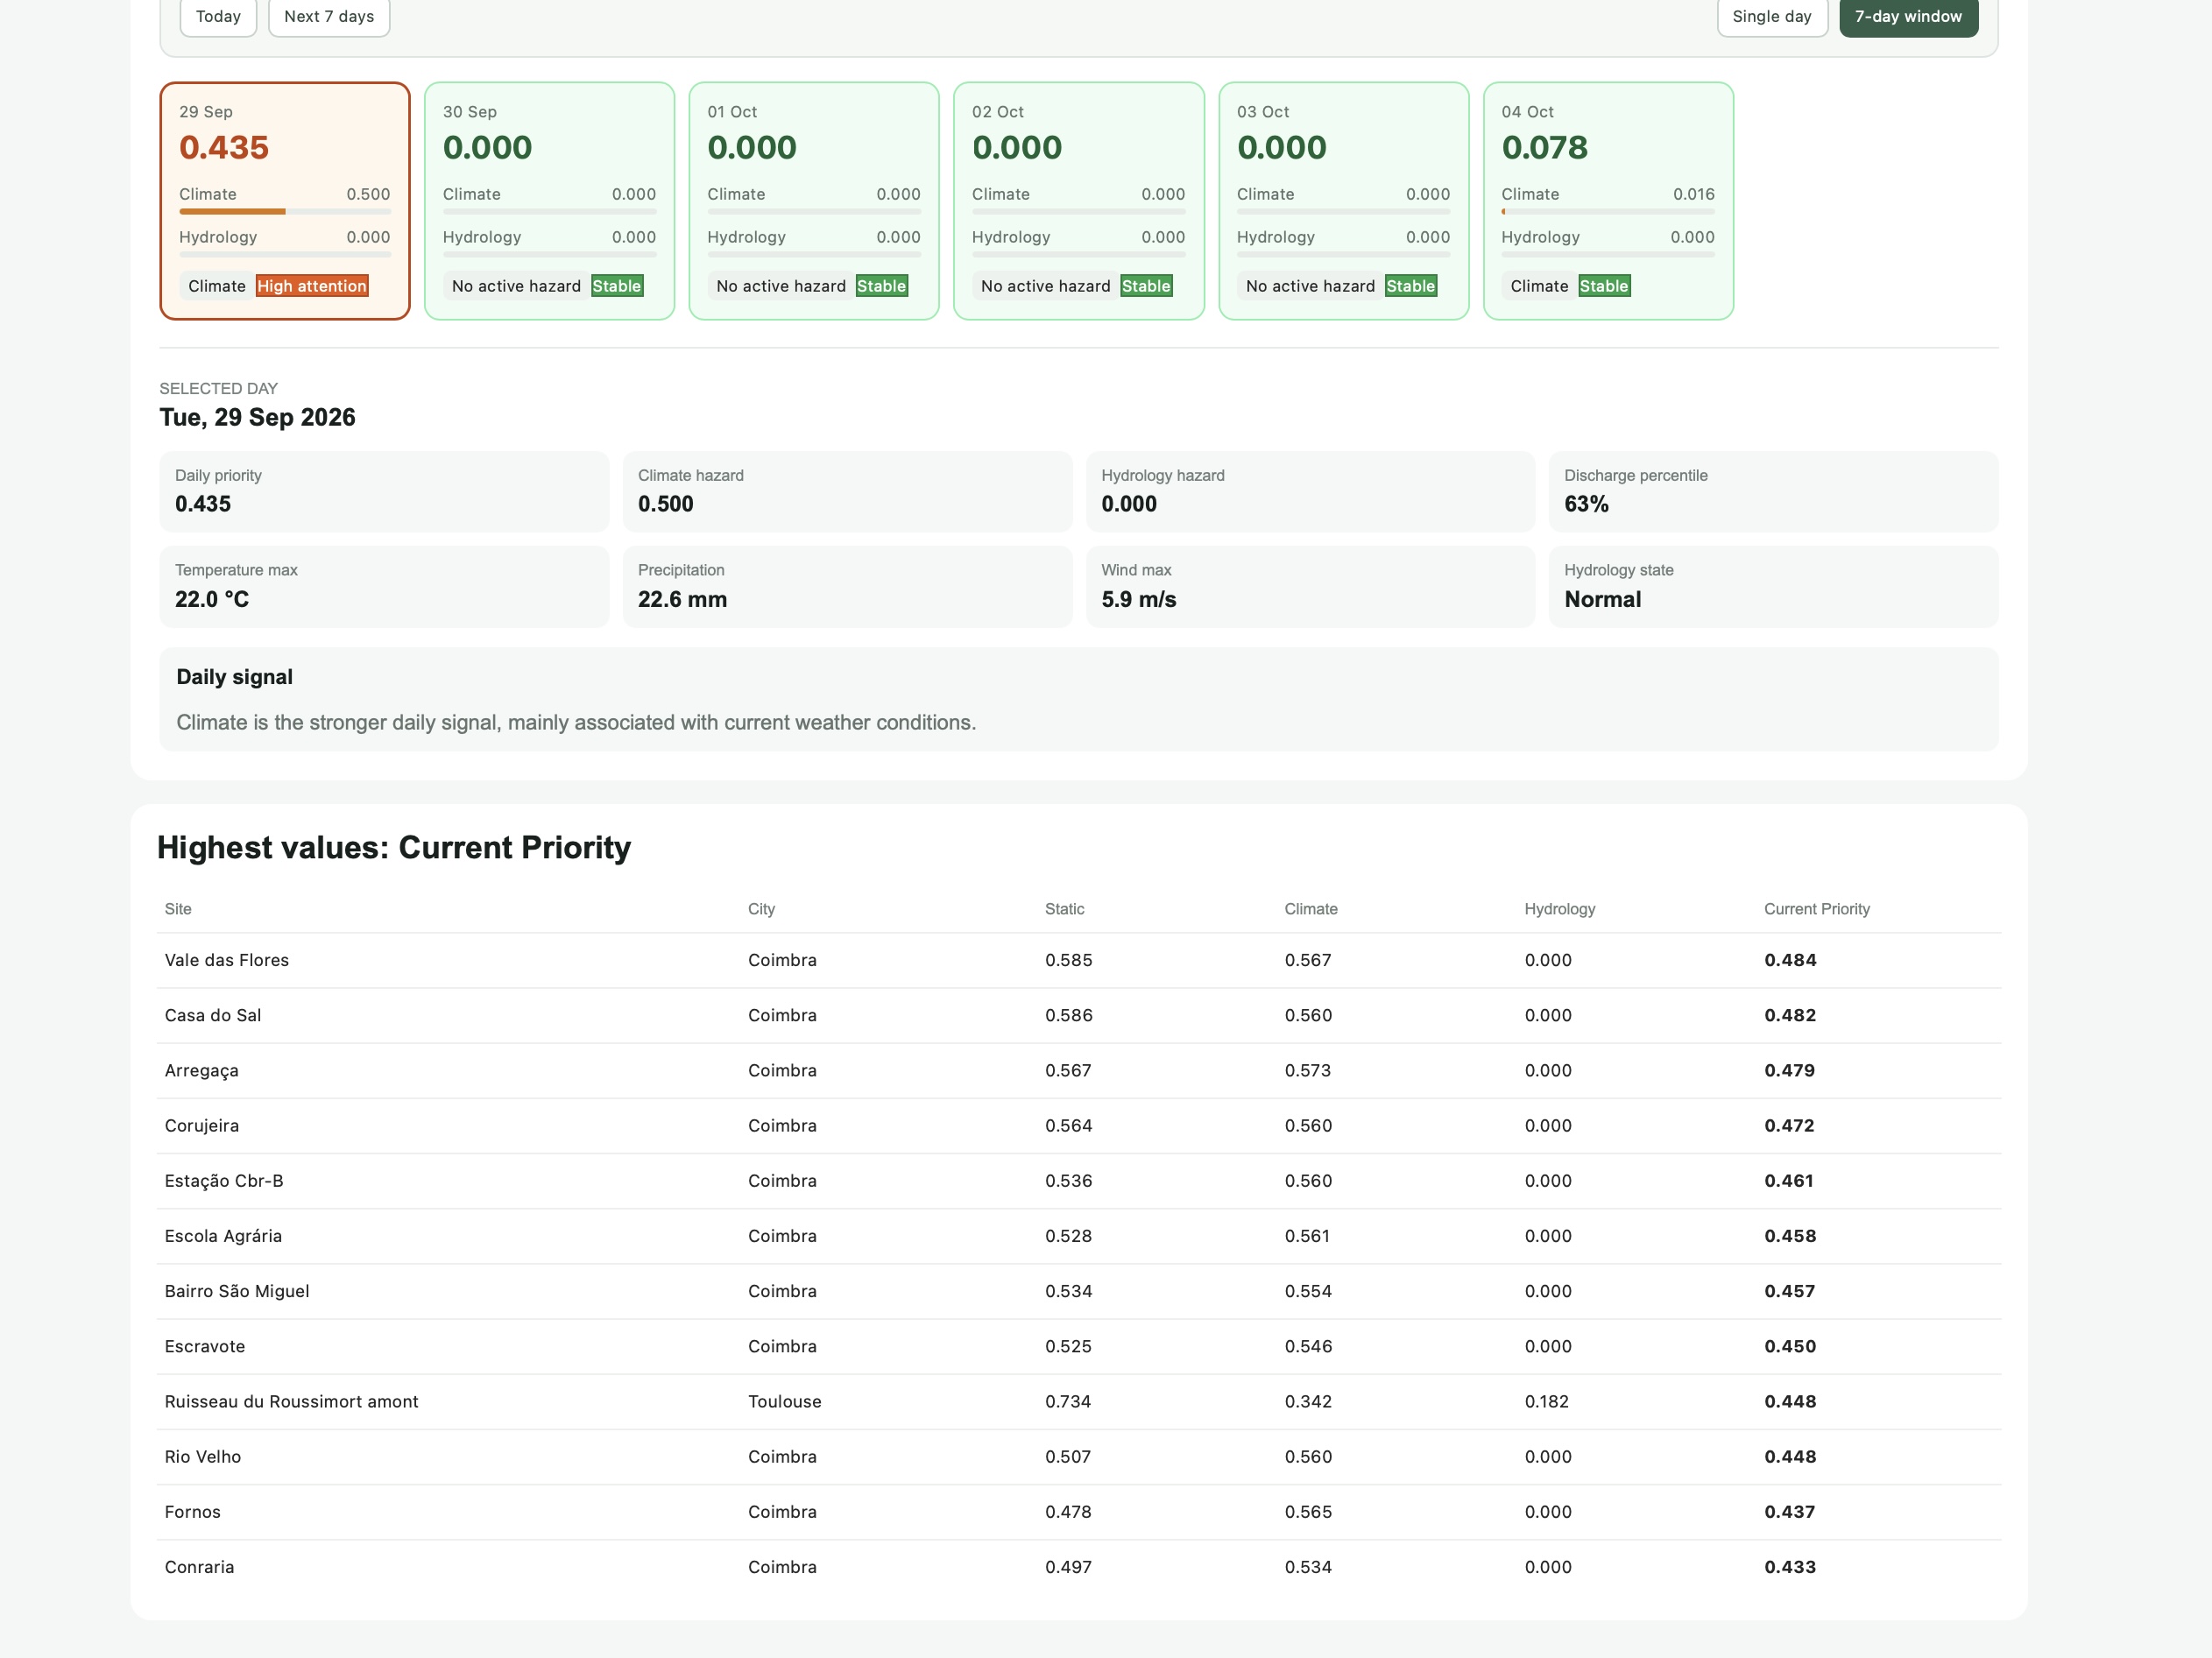
Highest values: Current Priority
Inspiration
Urban freshwater monitoring often involves many sites, changing environmental conditions, and limited time for field work. The challenge is not simply collecting more data, but deciding where to look first, when to look, and why.
We built AquaConnect around that decision problem. Our goal was to turn environmental data into an interpretable monitoring workflow while keeping the connection between model-based screening and real field observations.
What it does
AquaConnect is a network-aware freshwater resilience monitoring and ecological decision-support dashboard covering all 106 monitoring sites across 5 European cities. It combines persistent background pressure with short-term climate and hydrological conditions to generate an event-informed "Current Priority" for monitoring.
AquaConnect also represents upstream and downstream river-network connectivity, so monitoring sites are not treated as isolated points. Network information contributes to background-pressure screening and helps represent potential pressure pathways through the river system. The "Ecological Outlook" keeps four mechanisms separate: Aquatic-life stress Algal-growth conditions Pollution-pulse potential Relative dilution context
“7-day monitoring outlook” adds the time dimension, helping users identify not only where monitoring attention may be useful, but also when.
A guided “Field Input” (with “Guide”) workflow allows users to add water quality measurements and direct field observations. These observations are stored as a separate evidence layer and can be compared with operational screening without overwriting the model outputs.
How we built it
The analytical pipeline was developed primarily in R.
Environmental inputs combine weather, river discharge, spatial pressure indicators, river-network information, historical water-quality context, and biological context. Climate screening considers heat, heavy rainfall, wind, and accumulated dryness. Hydrological screening evaluates current discharge relative to the seasonal historical of site conditions.
The web application was built with React and Vite, with interactive mapping and site level exploration. The final prototype is deployed as a live web application through Vercel. We designed the system around interpretability: users can move from network-wide monitoring priority to individual environmental drivers, ecological mechanisms, forecast days, and field evidence.
Challenges we ran into
One major challenge was integrating datasets that operate at different spatial and temporal scales while avoiding false precision. Historical water quality observations, live environmental conditions, river-network relationships, and short-term forecasts each represent different kinds of evidence. We therefore kept clear boundaries between operational model outputs, historical context, and users submitted observations.
Another challenge was communicating relative screening signals responsibly. A high monitoring priority does not mean ecological damage has occurred, and rainfall mobilisation potential does not mean a pollution event has been observed. These distinctions are made explicit throughout the interface.
Accomplishments that we're proud of
We are proud that AquaConnect brings several levels of freshwater monitoring into one working prototype: network scale prioritization, river connectivity, ecological screening, short-term outlooks, and field verification.
The project is fully interactive and deployed online rather than remaining a static concept or visualization.
We are especially proud of the field-evidence design. User observations can support, challenge, or add context to operational screening without silently changing the underlying model outputs.
What we learned
We learned that useful environmental decision support is not only about building more complex models. Interpretability, uncertainty, data provenance, and the distinction between prediction and observation are equally important when a tool is intended to support real monitoring decisions. We also learned that river-network structure provides important context that can be missed when monitoring stations are treated independently. Finally, building the field observation layer showed us that model outputs become much more useful when users can compare them directly with what is actually observed in the river.
What's next for AquaConnect
The next step is to connect AquaConnect with continuously updated monitoring and citizen-science observations and to expand field validation across additional freshwater systems. Future development could include automated observation ingestion, configurable alerts, additional monitoring networks, and closer integration with existing OneAquaHealth data infrastructures.
We also want to evaluate how well the monitoring-priority framework performs when used repeatedly over time and whether field observations can help improve future screening and validation. The longer-term goal is a practical workflow in which environmental models help prioritise monitoring, field observations provide verification, and both sources of evidence support more transparent and resilient freshwater management.
Built With
- gbif
- geojson
- glofas
- javascript
- leaflet.js
- open-meteo
- openstreetmap
- papa
- parse
- r
- react
- vite
- waterbase


Log in or sign up for Devpost to join the conversation.