Inspiration
East Gainesville schools face complex, interconnected challenges involving enrollment, school choice, funding, staffing, capacity, and student outcomes. We wanted to make these patterns easier for residents and decision-makers to understand.
What it does
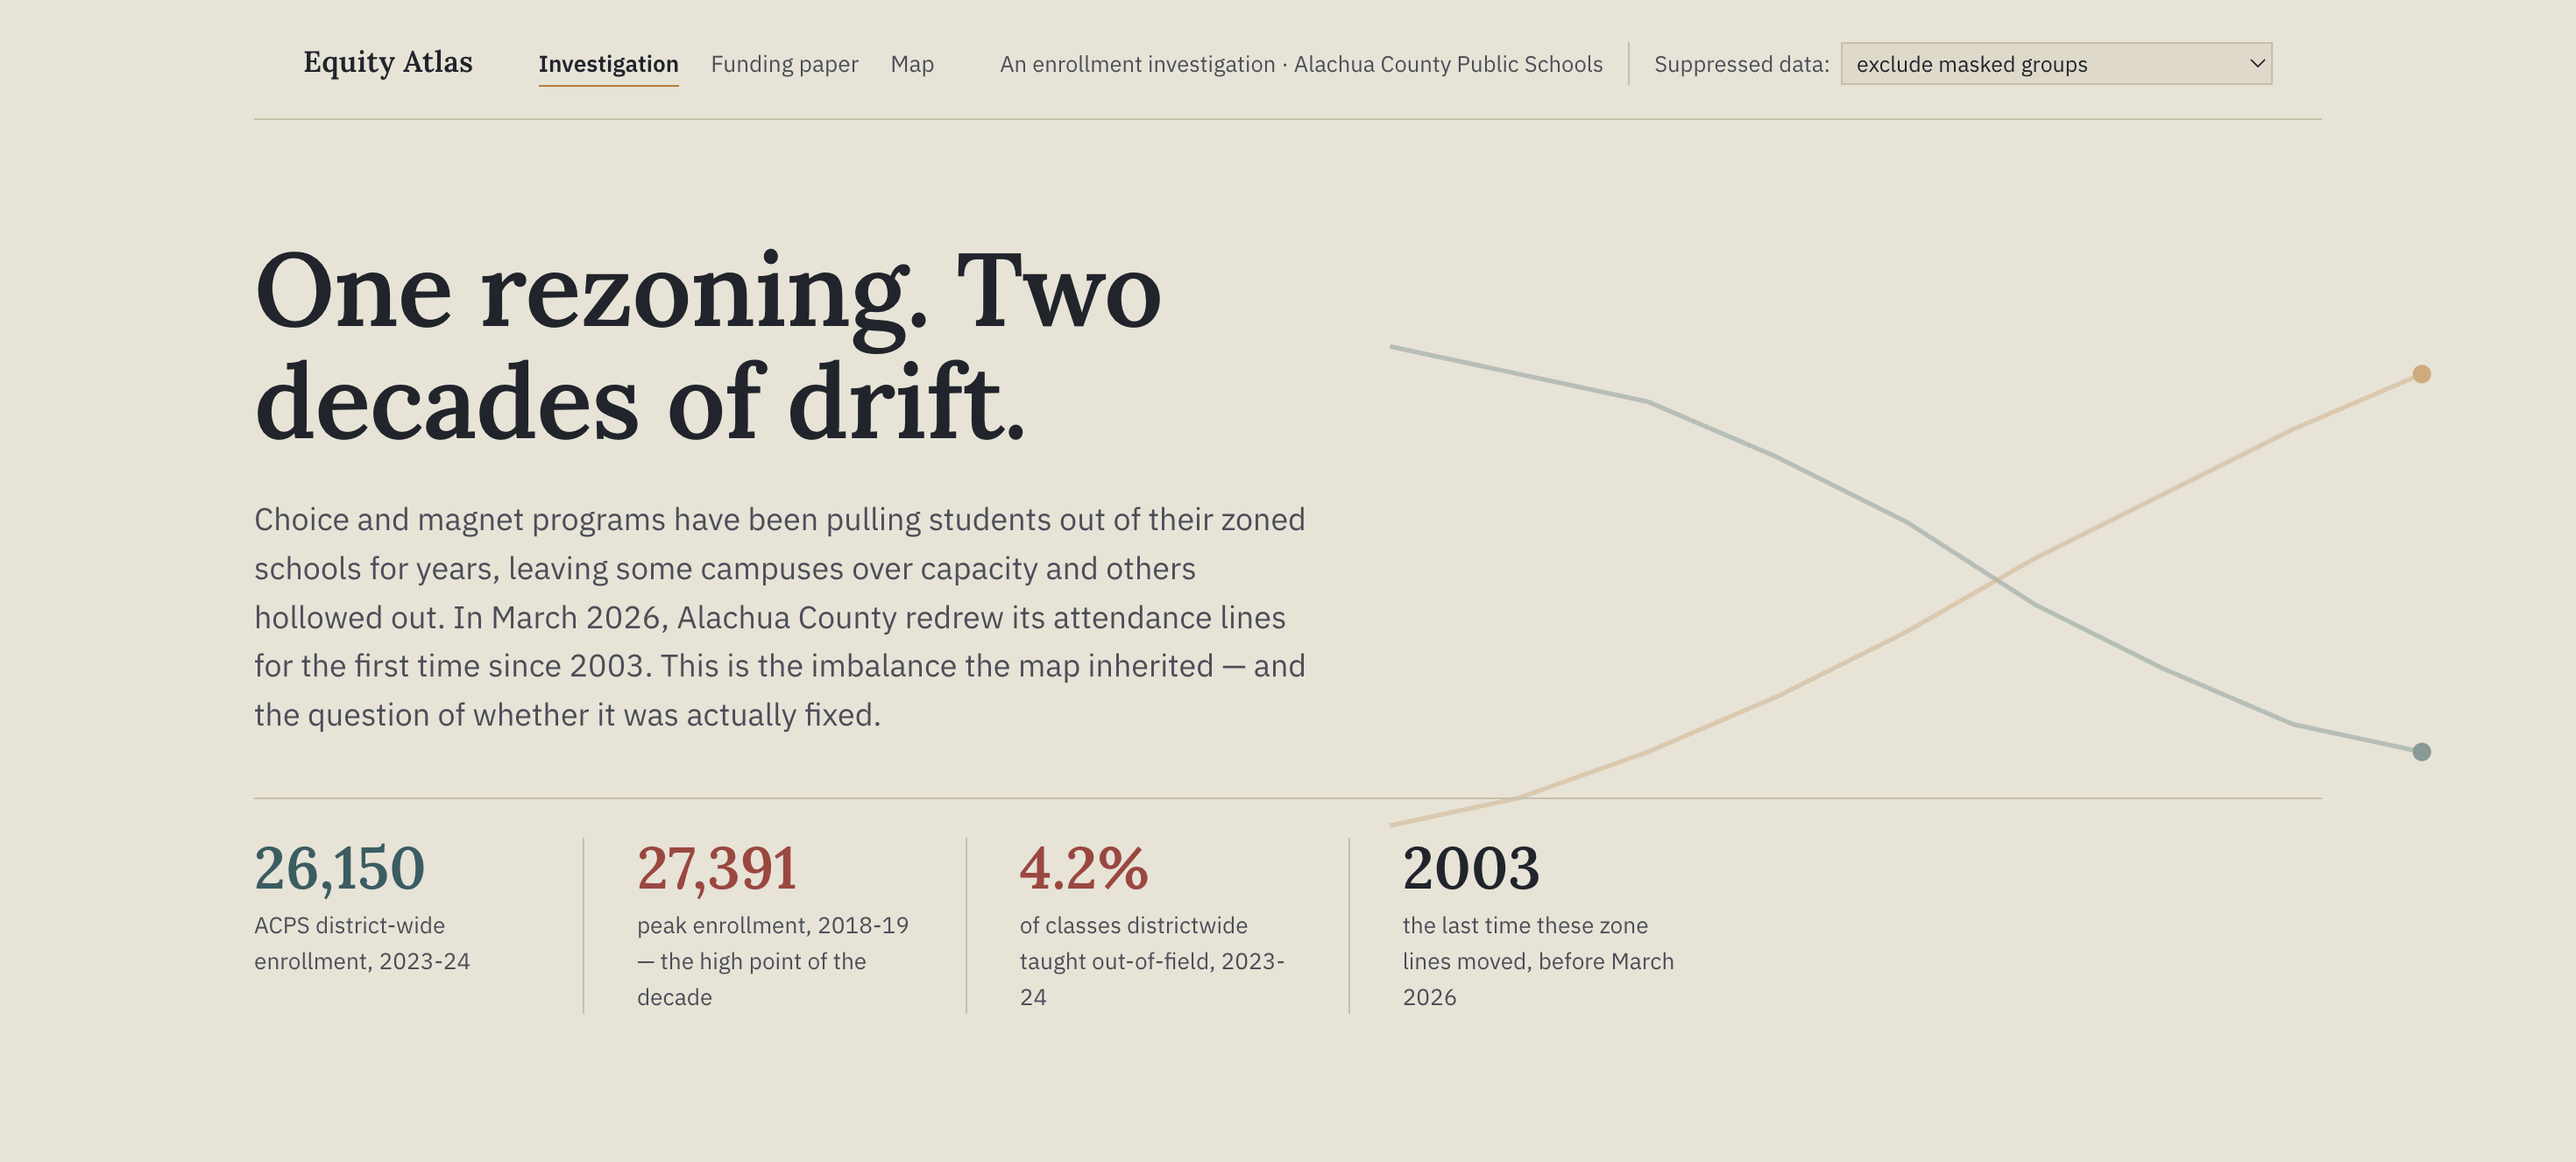
Equity Atlas is an interactive data story and map for Alachua County Public Schools. It connects public datasets to show how school resources, enrollment trends, attendance zones, teacher staffing, and student outcomes intersect—especially in East Gainesville.
How we built it
We built a lightweight web application using HTML, CSS, vanilla JavaScript, SVG visualizations, Leaflet.js, OpenStreetMap, JSON, and GeoJSON. We processed Florida Department of Education and ACPS data with Python, openpyxl, and xlrd.
Challenges we ran into
The data came from different years, formats, and sources, making school-level data integration difficult. Some values were suppressed or incomplete, and the available attendance-zone data did not provide a perfect historical comparison. We also had to distinguish correlation from causation.
Accomplishments that we’re proud of
We created a usable public-facing prototype that turns complex education data into an accessible visual story. The project combines multiple datasets, interactive maps, school comparisons, and equity-focused charts in one experience.
What we learned
Data visualization is most powerful when paired with context and humility. A chart can reveal an important pattern, but it must also explain limitations, missing data, and what conclusions cannot yet be made.
What’s next for Equity Atlas
We want to add more recent and complete data, improve school boundary comparisons, include community feedback, add scenario modeling, and create tools that help residents and policymakers evaluate possible investments and interventions.
Built With
- css3
- fetchapi
- flask
- geojson
- git
- github
- html5
- javascript
- json
- leaflet.js
- openpyxl
- openstreetmap
- python
- svg
- xlrd


Log in or sign up for Devpost to join the conversation.