Inspiration
I've been chasing sunsets around Taiwan for years and writing them up at sunsetchasingtaiwan.com - as a photographer there's a lot of details I consider - where to stand, what the view is actually like, how crowded it gets, etc. But what the website could never answer is the question I ask myself at five in the afternoon: is tonight worth going out for, and where can I go that's not too far from me right now?
Taiwan makes that question hard. The island is small enough that one weather system covers all of it, so on a wet evening every spot might be a washout, and on a good one you still have to pick. And the best viewpoints tend to be up a mountain served by a bus that stops running before the sky finishes. I have walked down from a few, and driven scooters through poorly lit dogs chased by wild dogs.
So I built the thing I wanted: a score for tonight, at every spot, important details to note, and the last train/subway/bus home next to it.
What it does
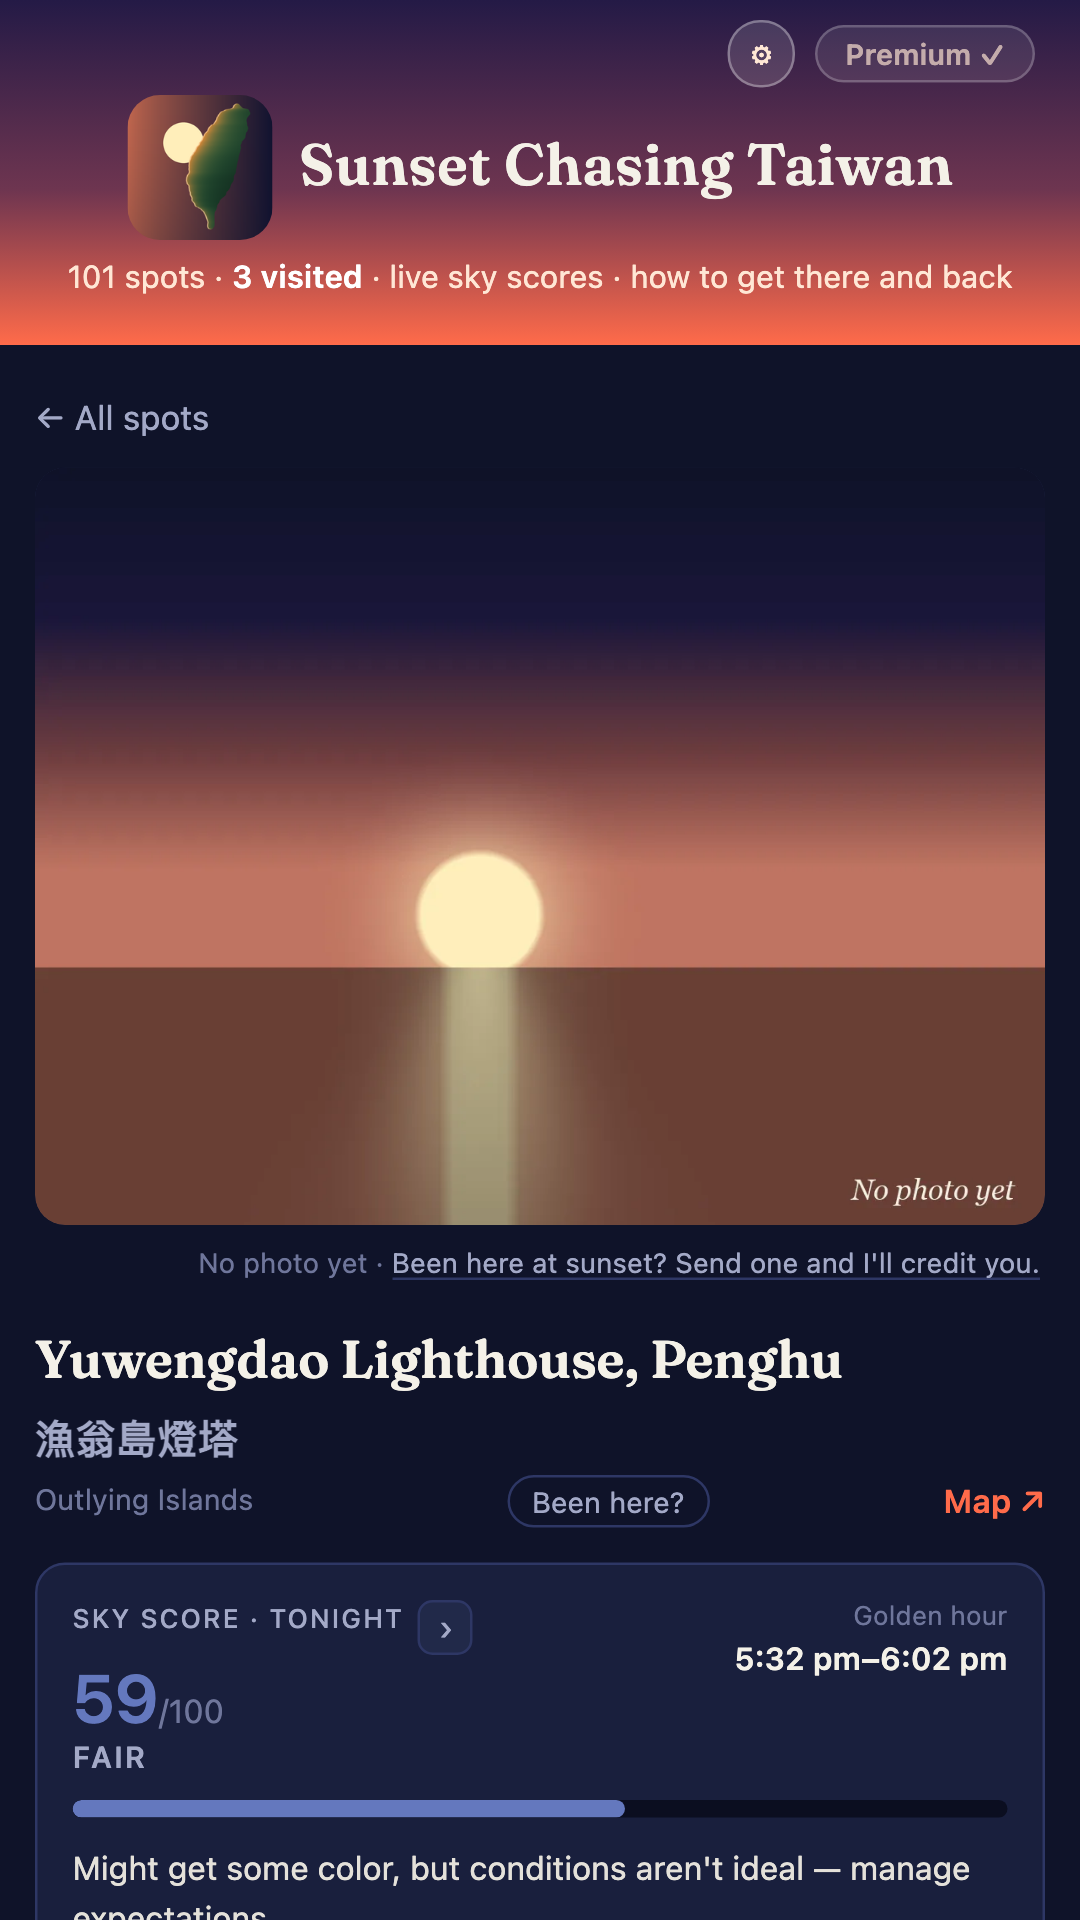
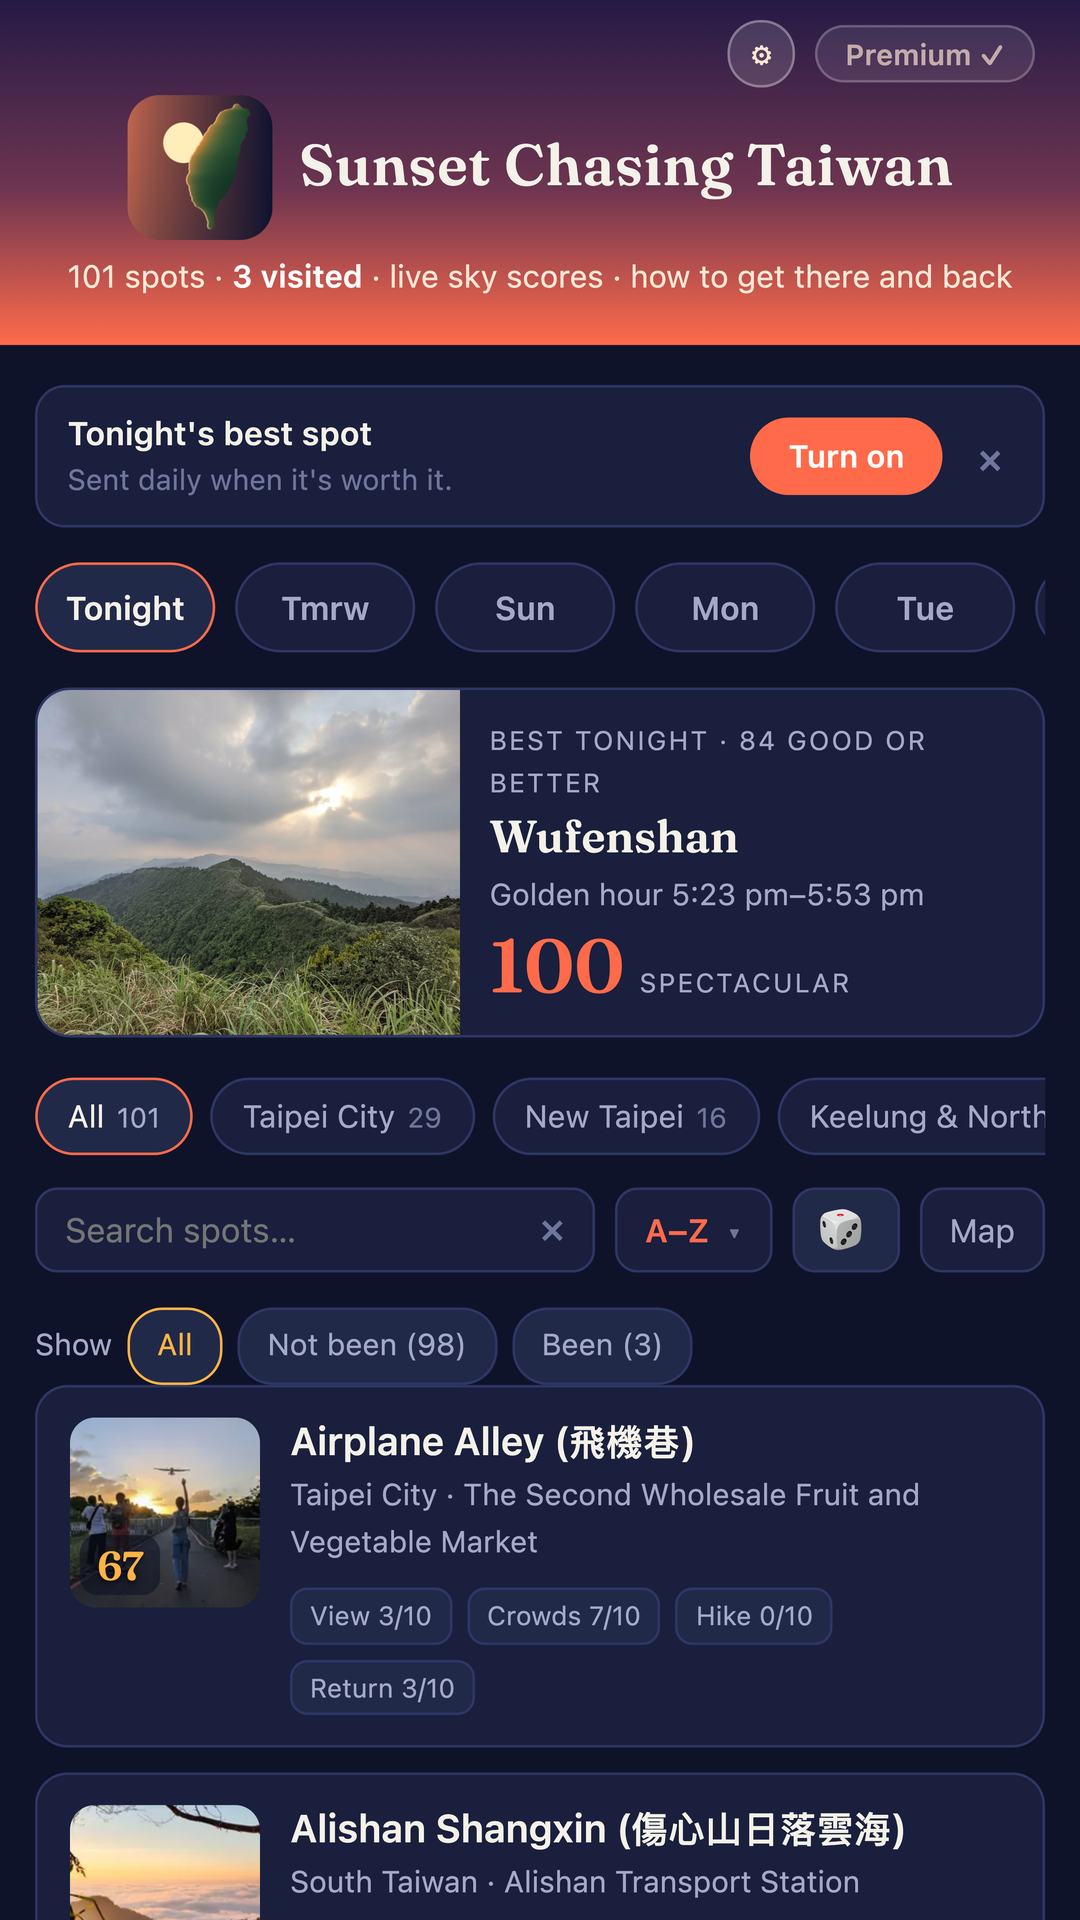
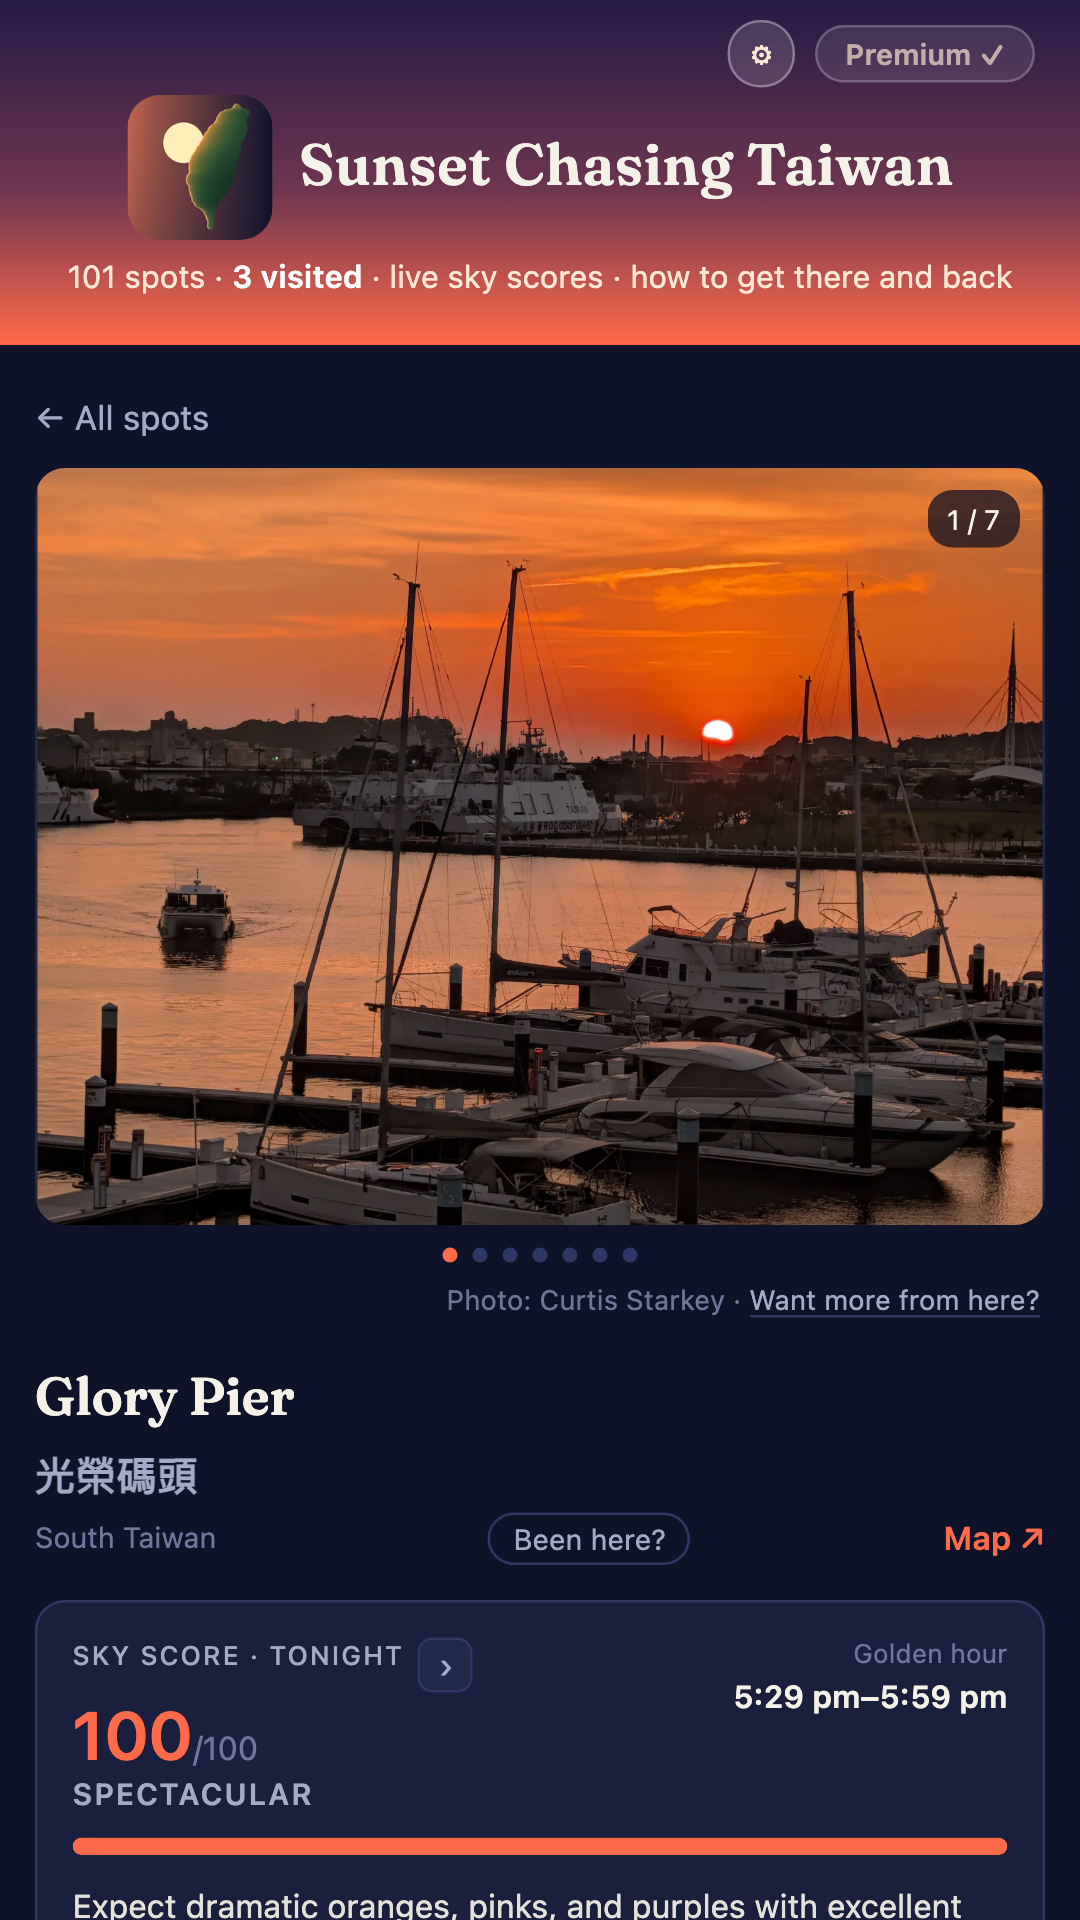
Every evening the app pulls the forecast for each spot's own coordinates at that spot's own sunset hour and scores the sky out of 100 - cloud cover, humidity, visibility, and whether rain or fog is going to ruin it. 30–70% cloud catches the most color and thus scores highest. A clear sky is good but never spectacular.
On top of the score, every spot carries four ratings I gave it from standing there: the view, how crowded it gets, how much of a hike it is, and the one nobody else gives you: how hard it is to get home once it's dark. Each spot lists its nearest station, the last train of the night, and a link to that line's timetable.
101 spots as of right now. About two thirds I've visited and photographed myself. Thirteen are places I haven't reached, carrying Creative Commons photographs with the photographer credited on the spot. The rest are famous places with no photo yet - they say so, and ask you to send one.
How I built it
The whole app is one HTML file. No framework, no build step, no bundler. The 101 spots and their photos are embedded in it, which is why it works with no signal: the only network call is the weather. That file is deployed to Netlify and wrapped in Capacitor for Android.
- RevenueCat handles the three plans - monthly, yearly with a trial, and a one-time lifetime unlock. One SDK, one entitlement, and the client treats local storage as a cache of the store's answer rather than the truth.
- OneSignal does the part I care most about (below).
- A Cloudflare Worker on an hourly cron scores every spot, finds the best in each region, and hands OneSignal a tag filter. It has no database.
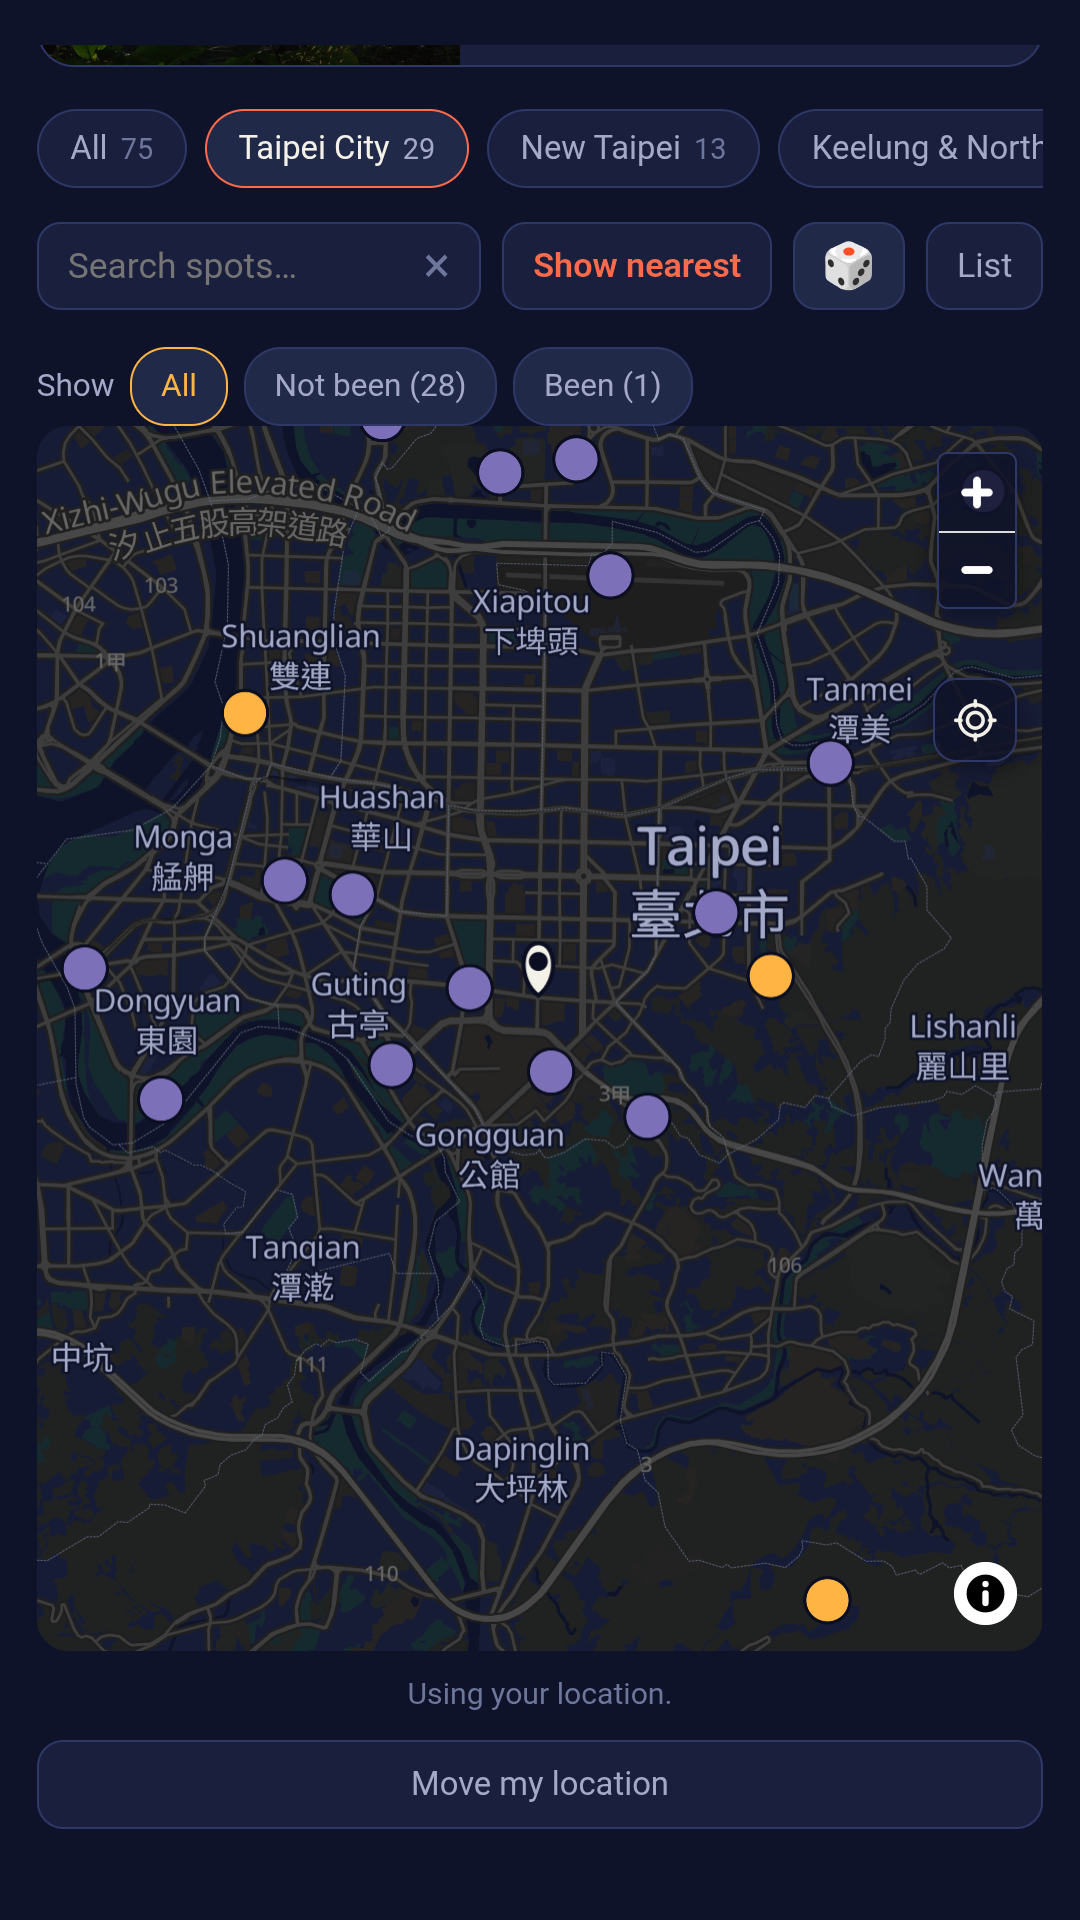
- The map is MapLibre reading a 91 MB Protomaps extract of Taiwan out of my own Cloudflare R2 bucket by HTTP range request. I costed MapTiler, Mapbox and Google first: Google came to roughly £1,700 a year at the traffic I was modelling, R2 came to about £1, ships no API key, and sends nothing about a reader to anyone.
- The app icon is Taiwan drawn from its real coastline - 406 Natural Earth points, projected, with the sun placed by finding the coast on the sun's own screen row so it occludes correctly. This took a lot of takes to get right.
Keeping them coming back (OneSignal)
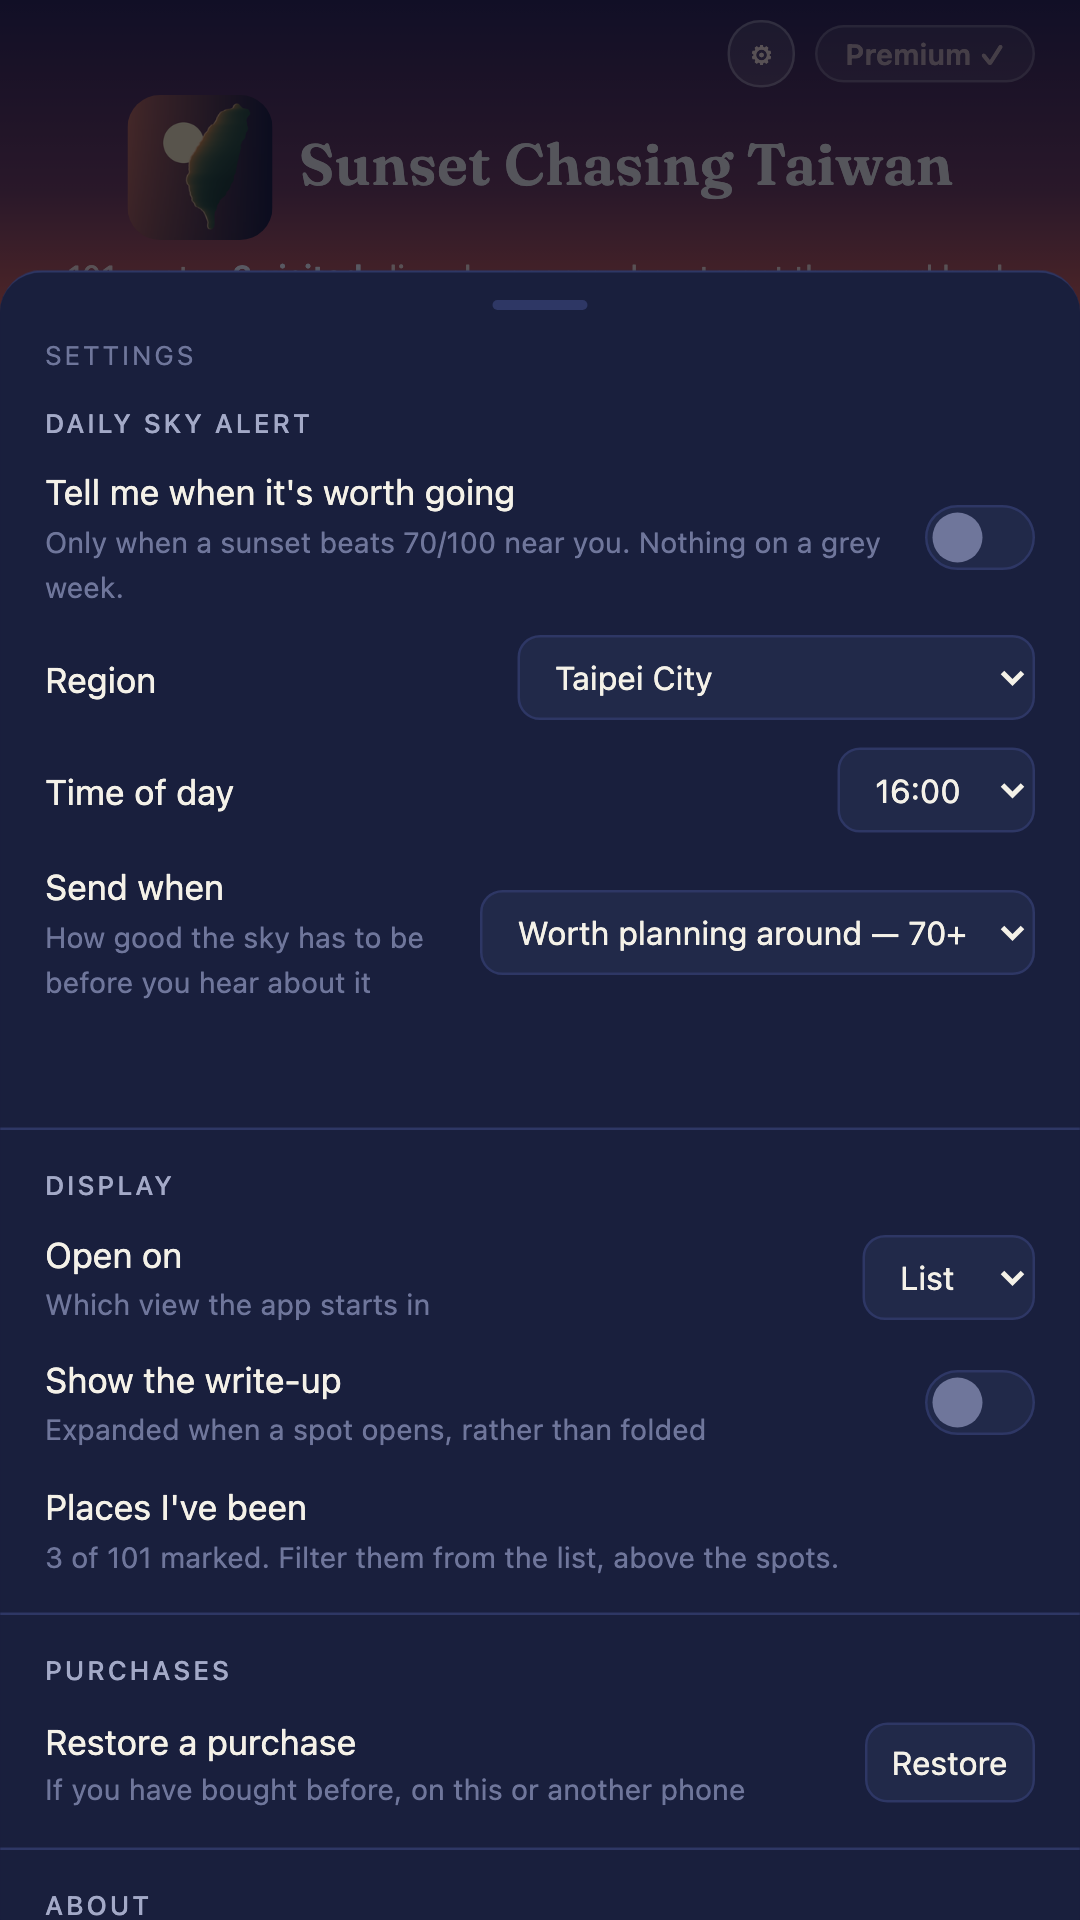
A daily notification that fires whatever the sky is doing is one you learn to ignore. So the reader sets the bar:
- A threshold they choose. Every install is tagged with a region, an hour and a minimum score. The Worker offers every region every evening and lets OneSignal's filter decide who actually hears about it. Sending nothing is the healthy outcome on a grey week, and that's exactly why the ones that do arrive get opened.
- A Sunday outlook. Sunday at 10am, one notification naming the single best evening of the coming week in your region. "Thursday looks best" is a reason to come back that "tonight is a washout" never gives.
- In-app messages, aimed with on-device triggers rather than segments, so someone who has never turned notifications on still gets offered the thing, without spending the one clean shot the app gets at the permission prompt.
Tapping any of them opens the spot it names, on the evening it means.
Challenges
The scoring model was wrong for the climate I ported it from. The original was a Python script I ran for Taipei. Once it was running against 101 real places I measured it: 60 spots × 7 days of actual forecast data. It's just too humid in Taiwan, and a large humidity penalty was firing 98% of the time. I also found cloud over 90% being charged twice. Fixing both moved a real evening I'd photographed from 25 to 47, which matched what I actually saw.
**At first I wanted to create my own map of Taiwan, and spent many iterations but realized each one was not as good as just using OpenStreetMap.
A button that quietly subscribed people. I found that my own Unlock button called the purchase function with no argument, which bought the first package in the offering - the monthly subscription - without ever showing a plan, a price or a term. I found it by tapping it. Every unlock control now opens the plan list, and the purchase can only be triggered from a button that displays what it costs.
What I learned
Measure it. Every real bug in this project was found by measurement and lost time to reasoning: the scoring retune came from 420 real forecasts, and a map layout bug I was sure I understood took three attempts until I opened a browser and read the actual pixel positions.
The other thing: the free tier is not the enemy. Marking spots you've been to, and a dice button that picks one for you, are both free. They're what brings people back, and that is what makes the paid part worth paying for.
What's next
A Chinese interface - most of the audience for this reads Chinese, and the score is the product, so the UI translates even where 101 write-ups don't. Then iOS, which is roughly half of Taiwan. And more spots: I add them as I shoot them, and readers are starting to send photos of the ones I haven't reached.
Built With
- android
- capacitor
- cloudflare-r2
- cloudflare-workers
- css3
- firebase
- geojson
- google-play-billing
- html5
- java
- javascript
- maplibre
- netlify
- onesignal
- open-meteo
- openstreetmap
- protomaps
- pwa
- python
- revenuecat
- service-workers
- wordpress


Log in or sign up for Devpost to join the conversation.