-
-
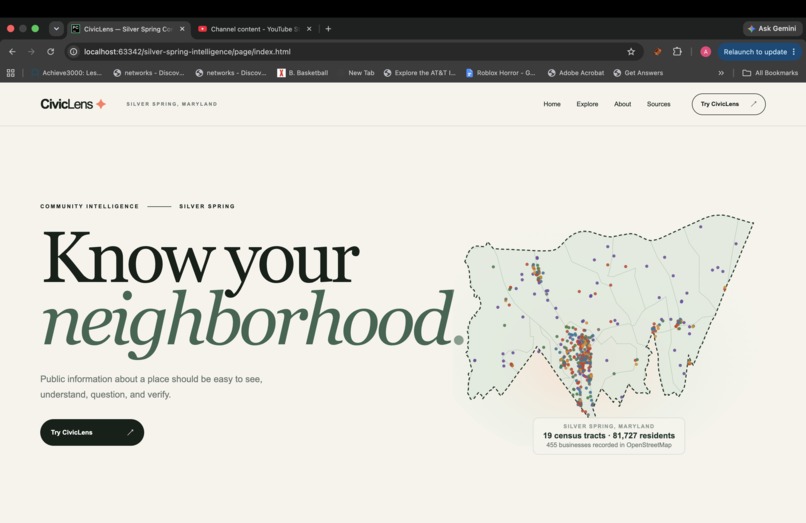
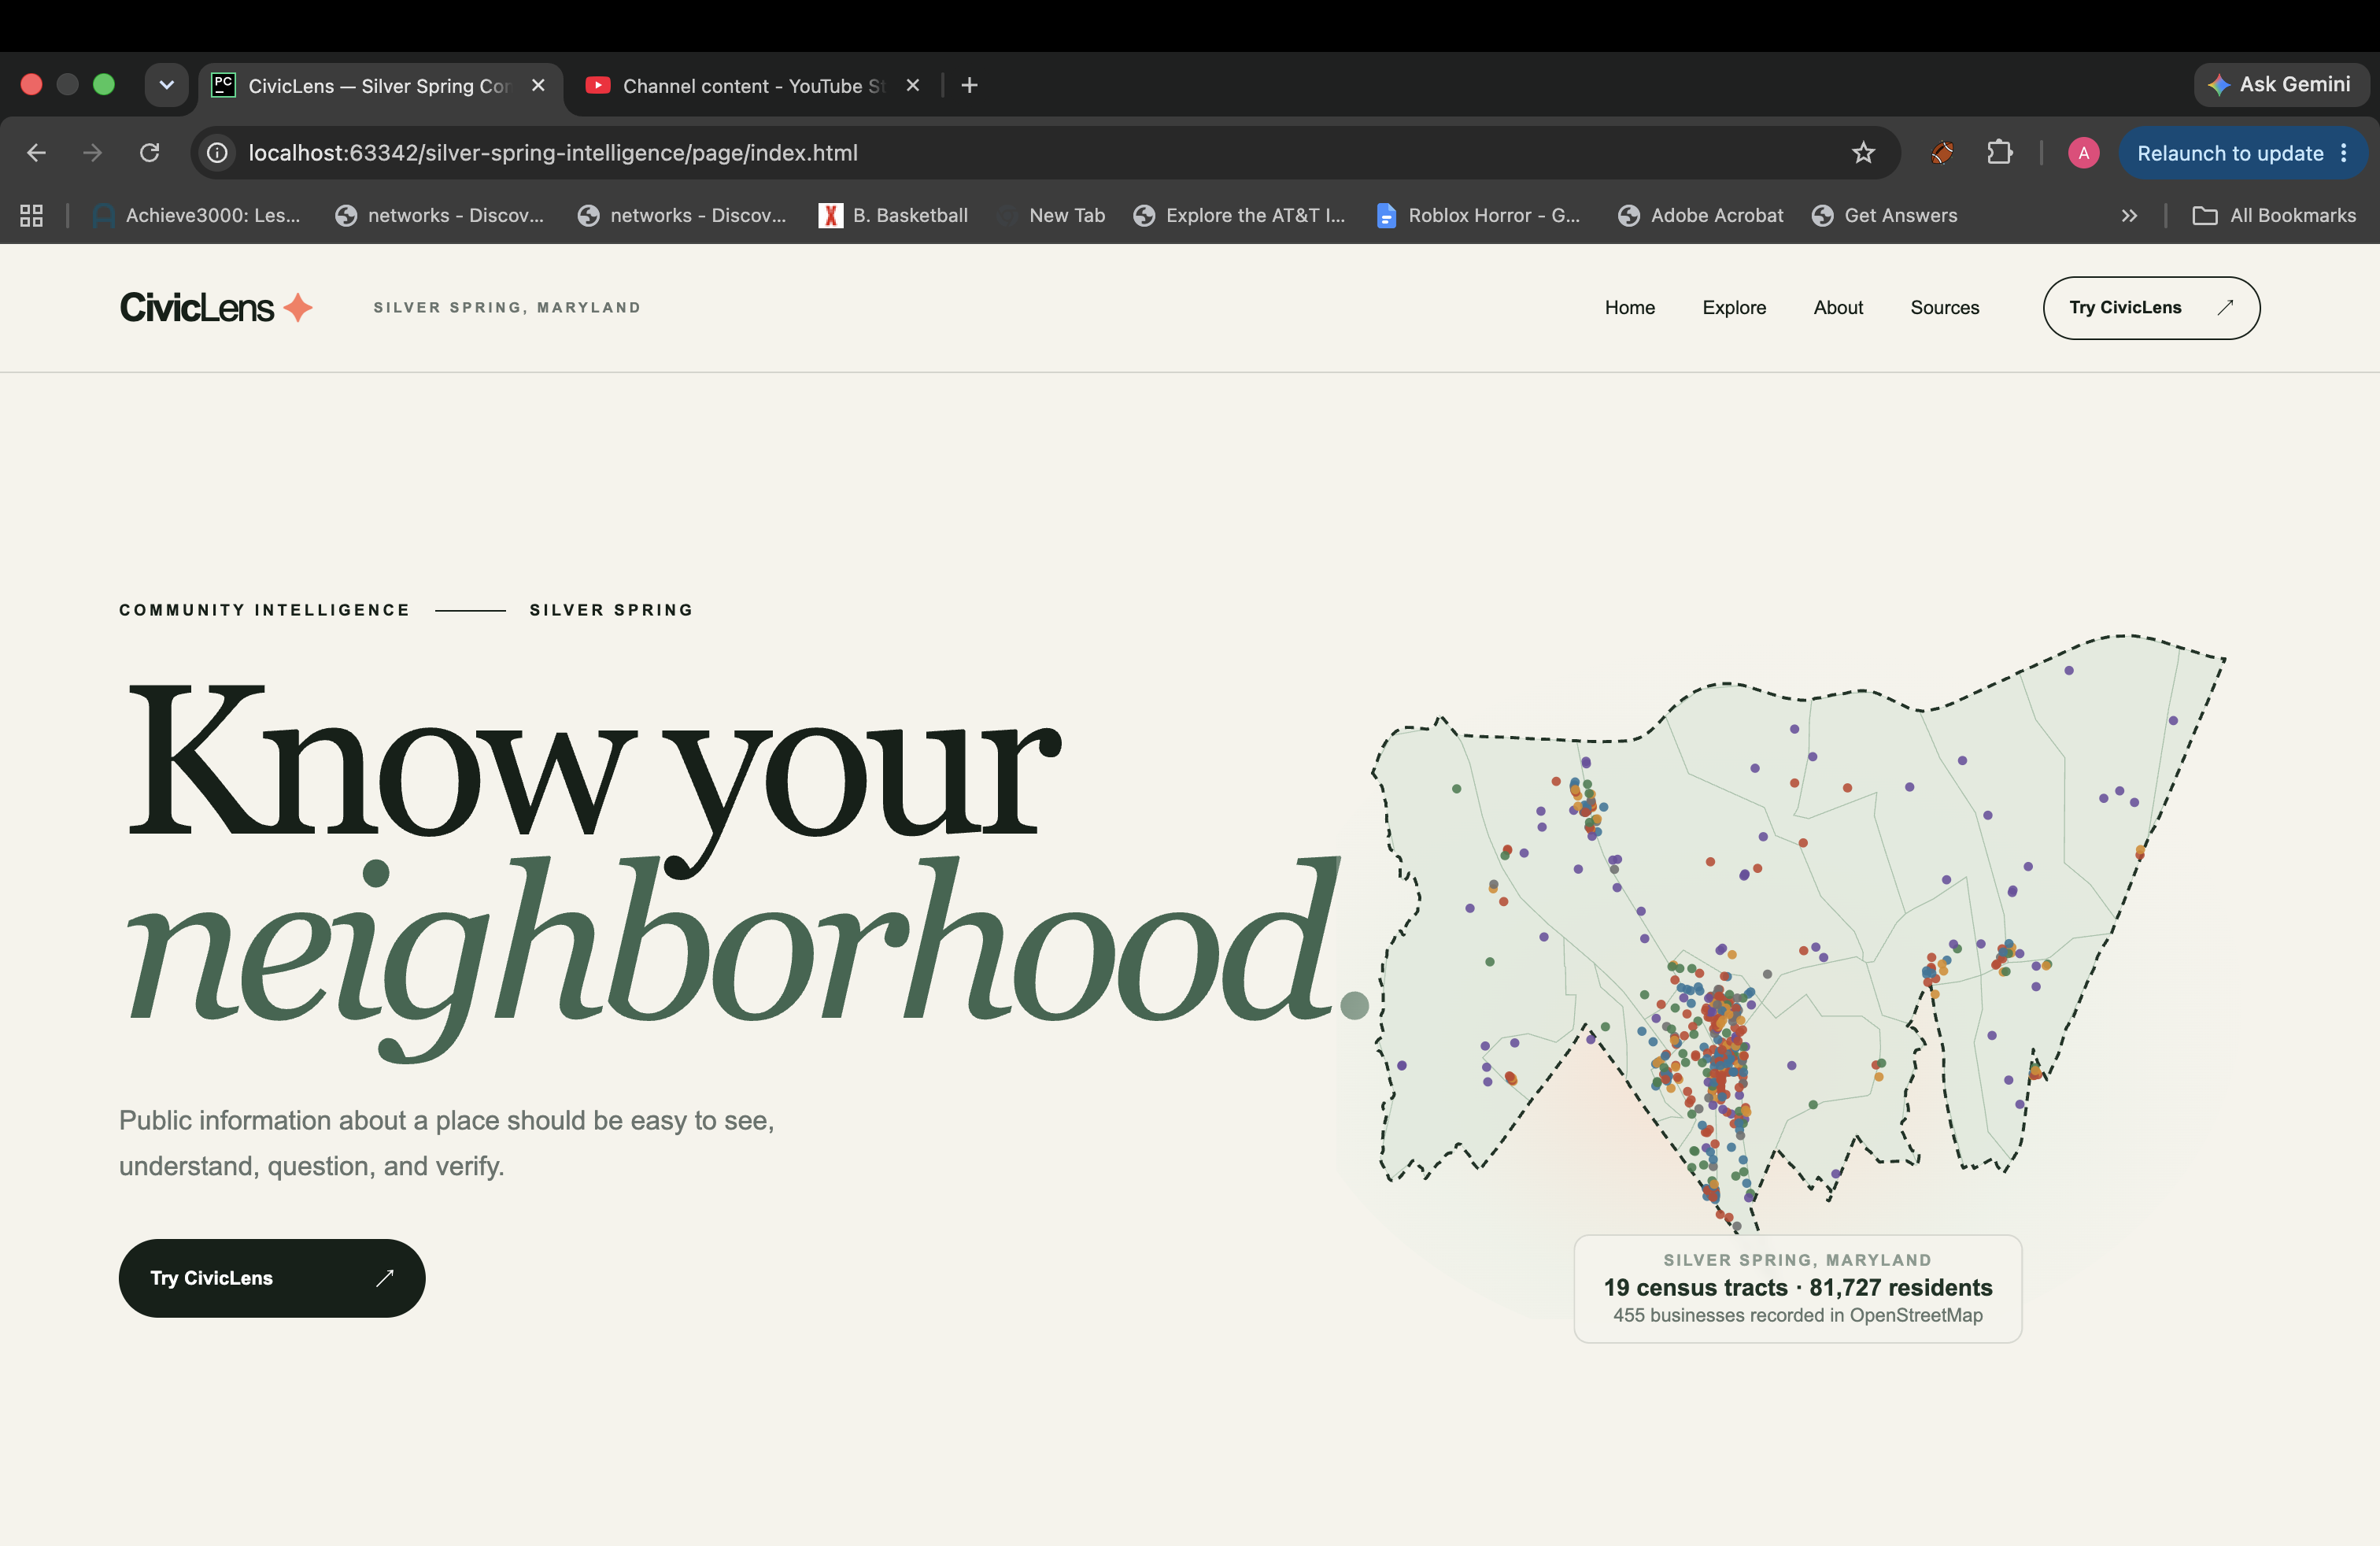
Silver Spring, drawn from the real Census boundary and 455 business locations.
-
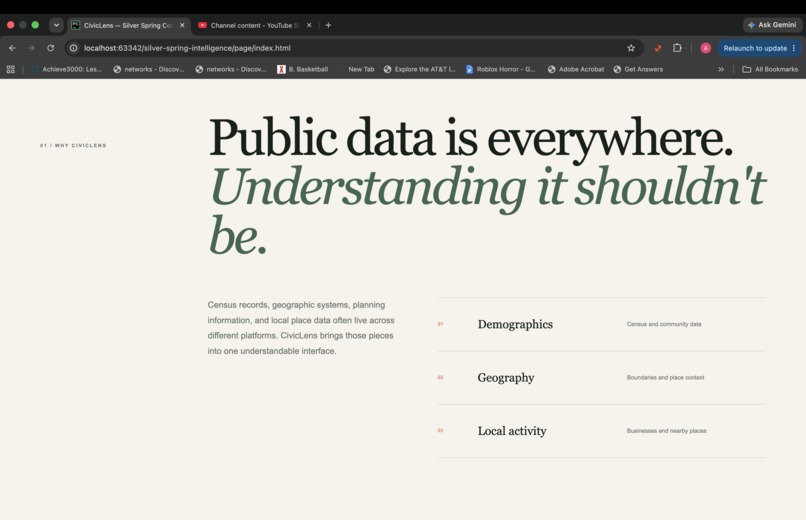
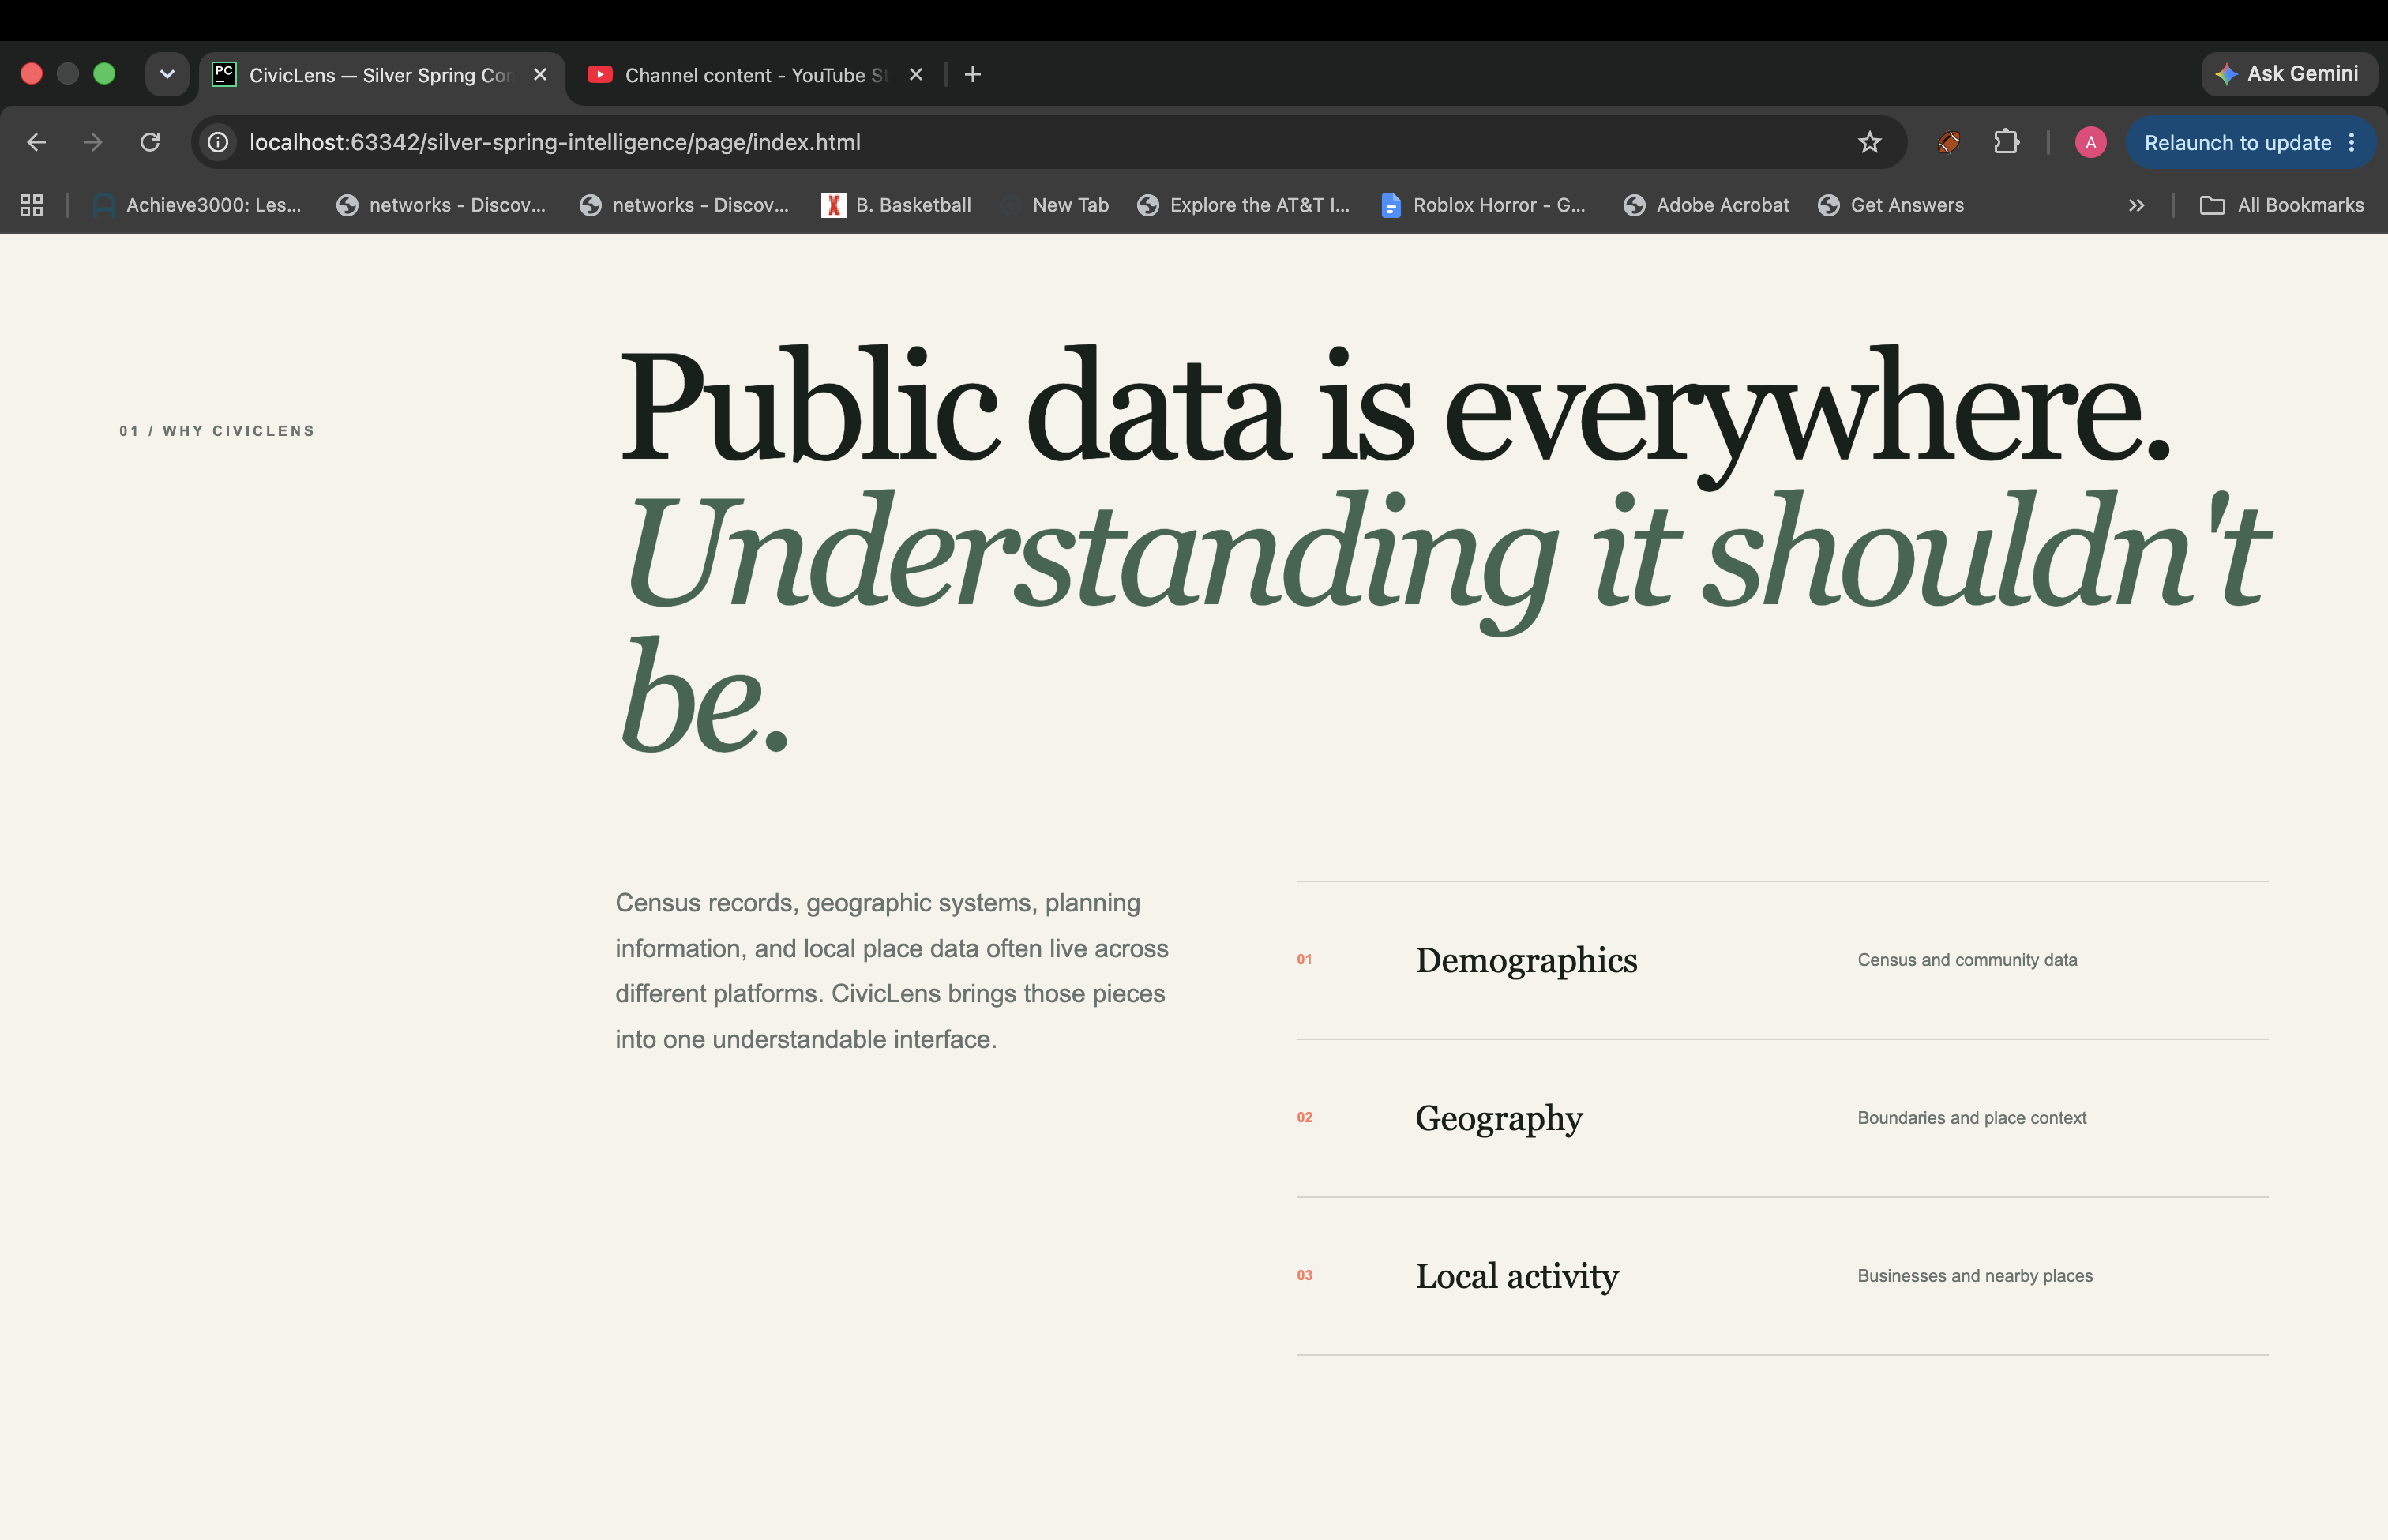
Public data lives in separate systems. CivicLens brings it into one place.
-
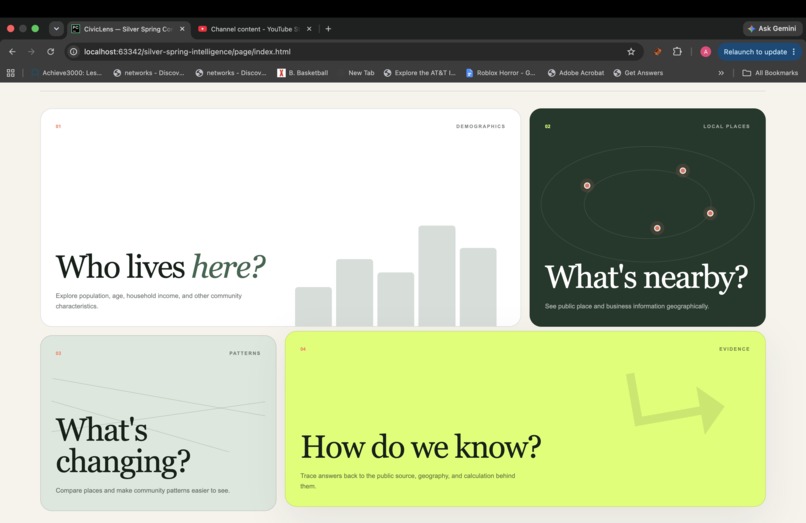
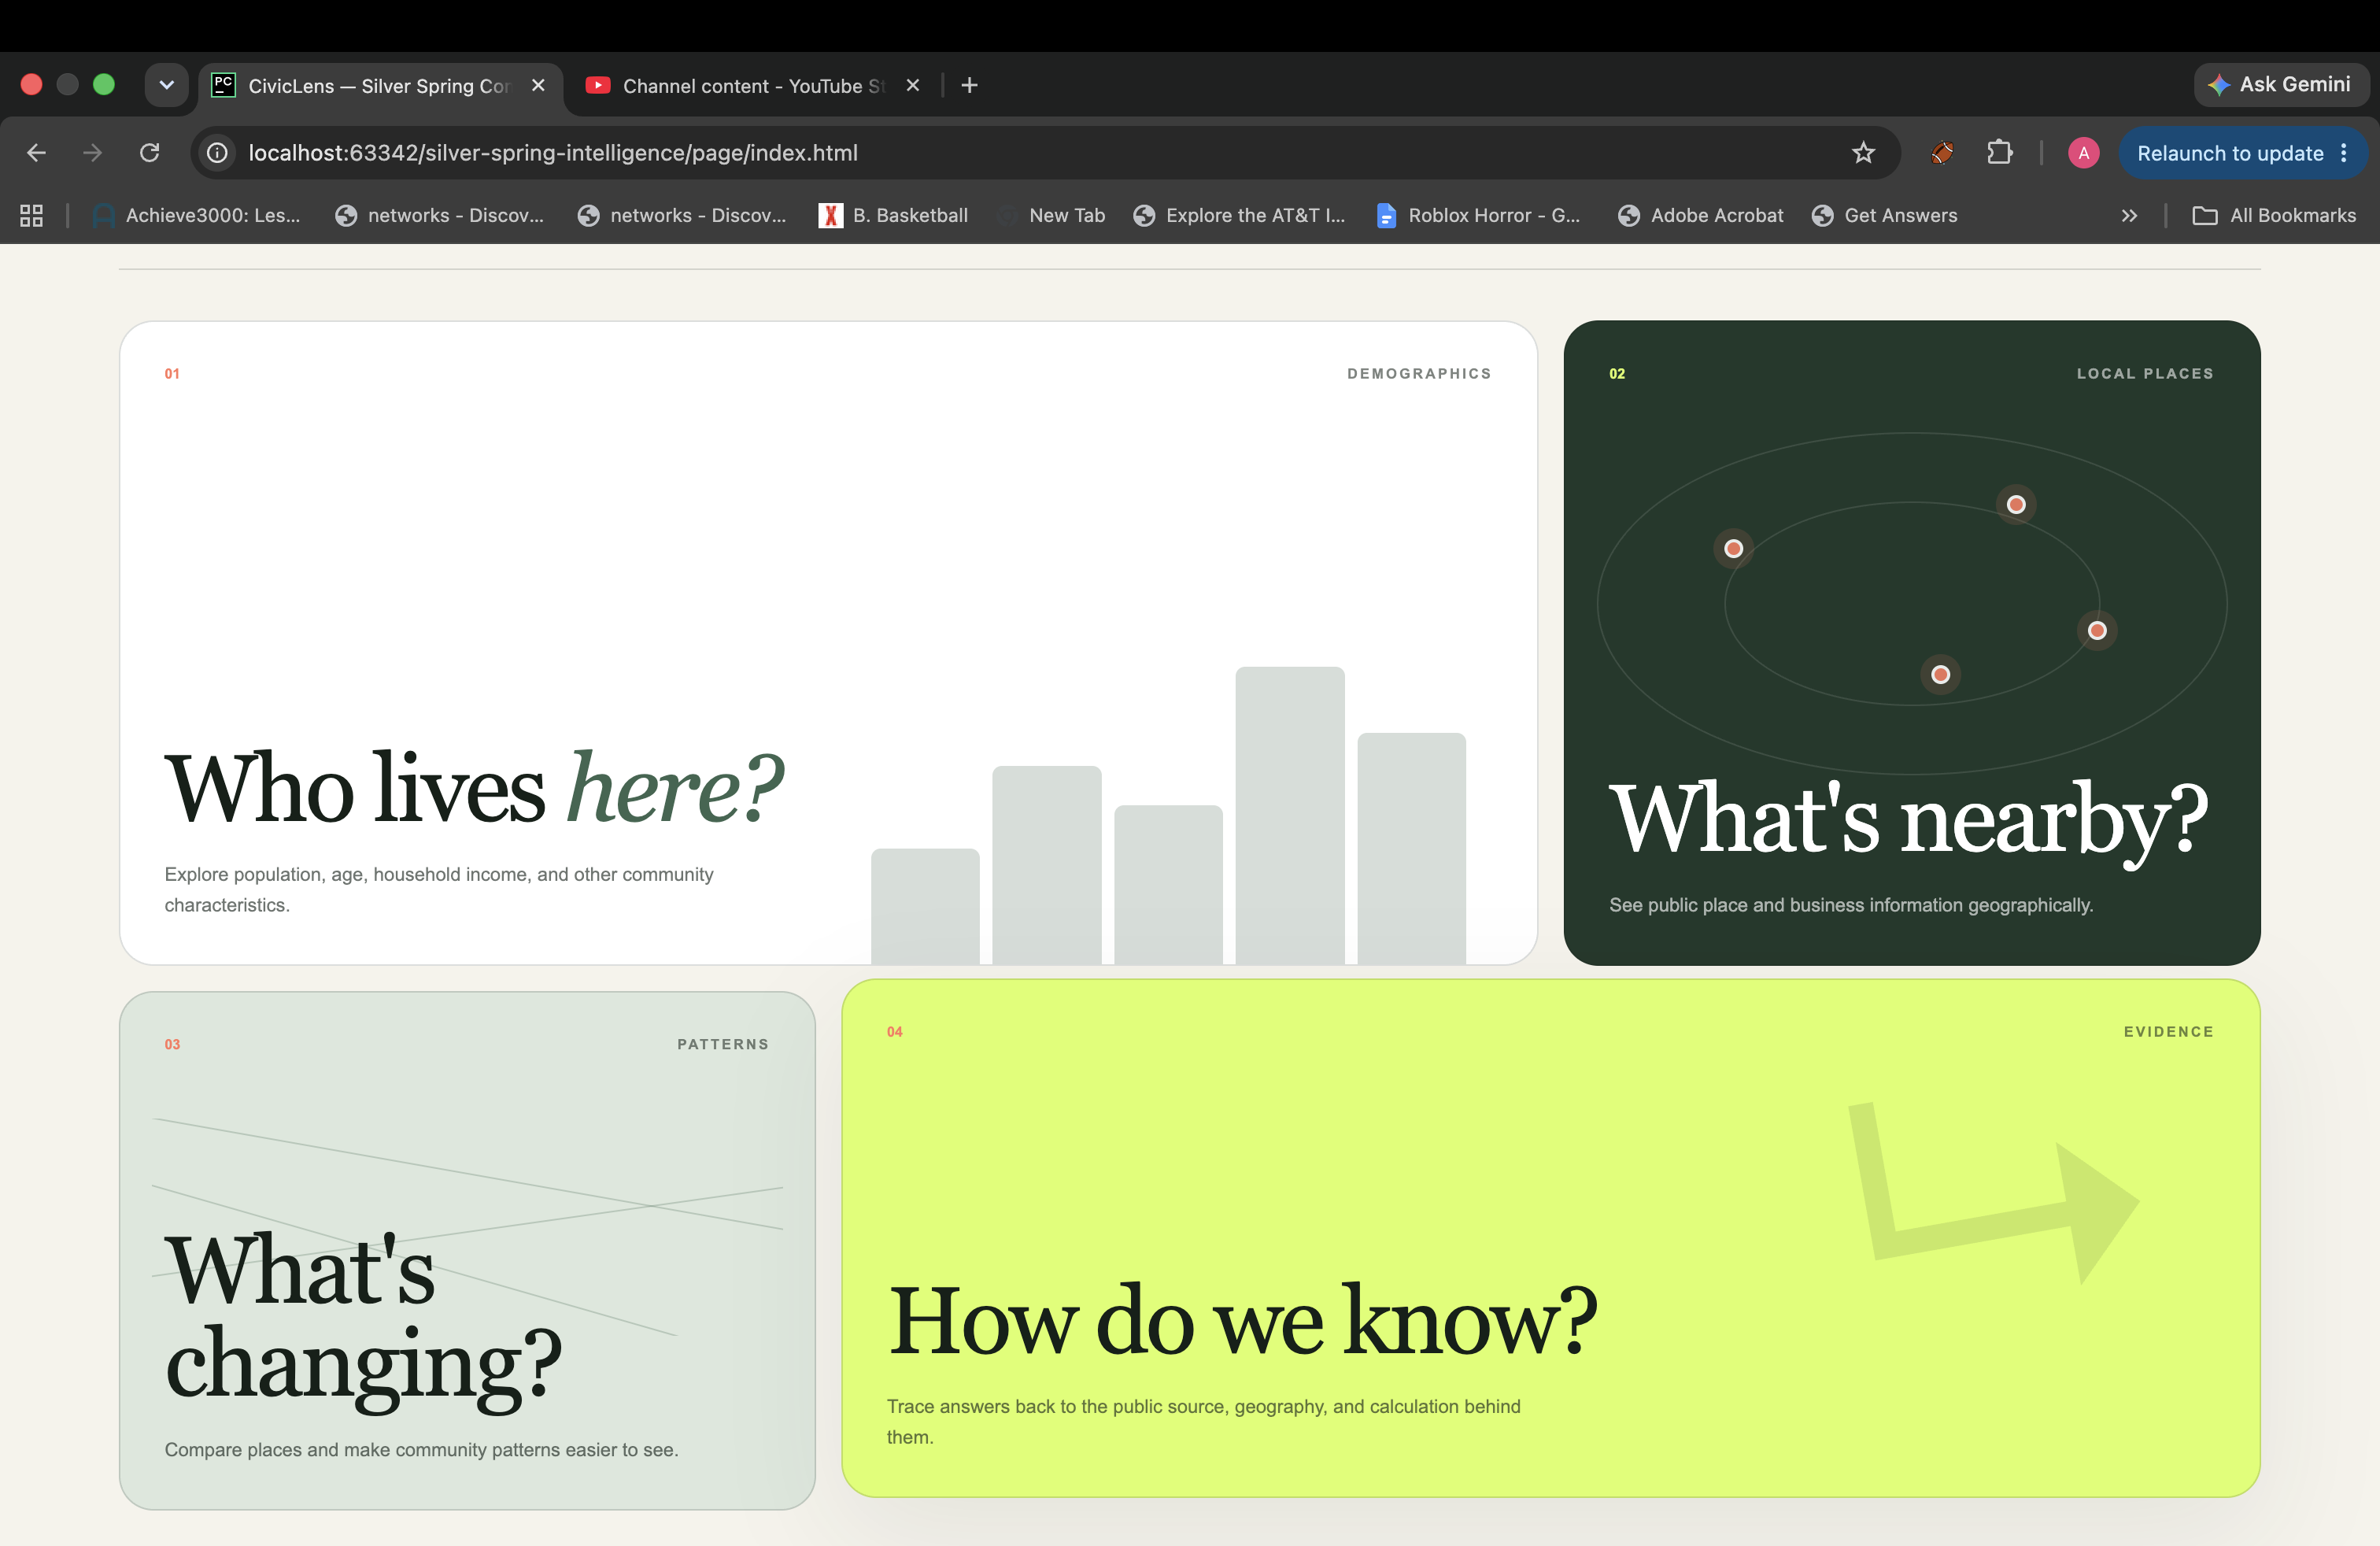
Who lives here, what is nearby, what is changing, and how do we know.
-
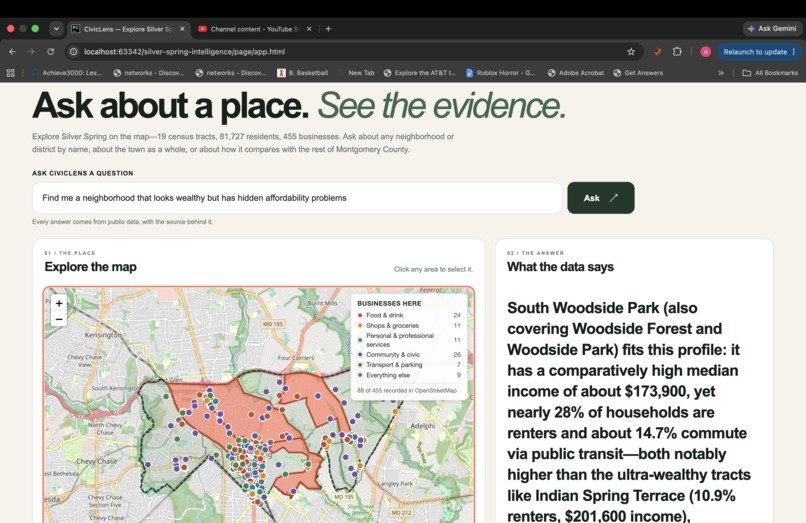
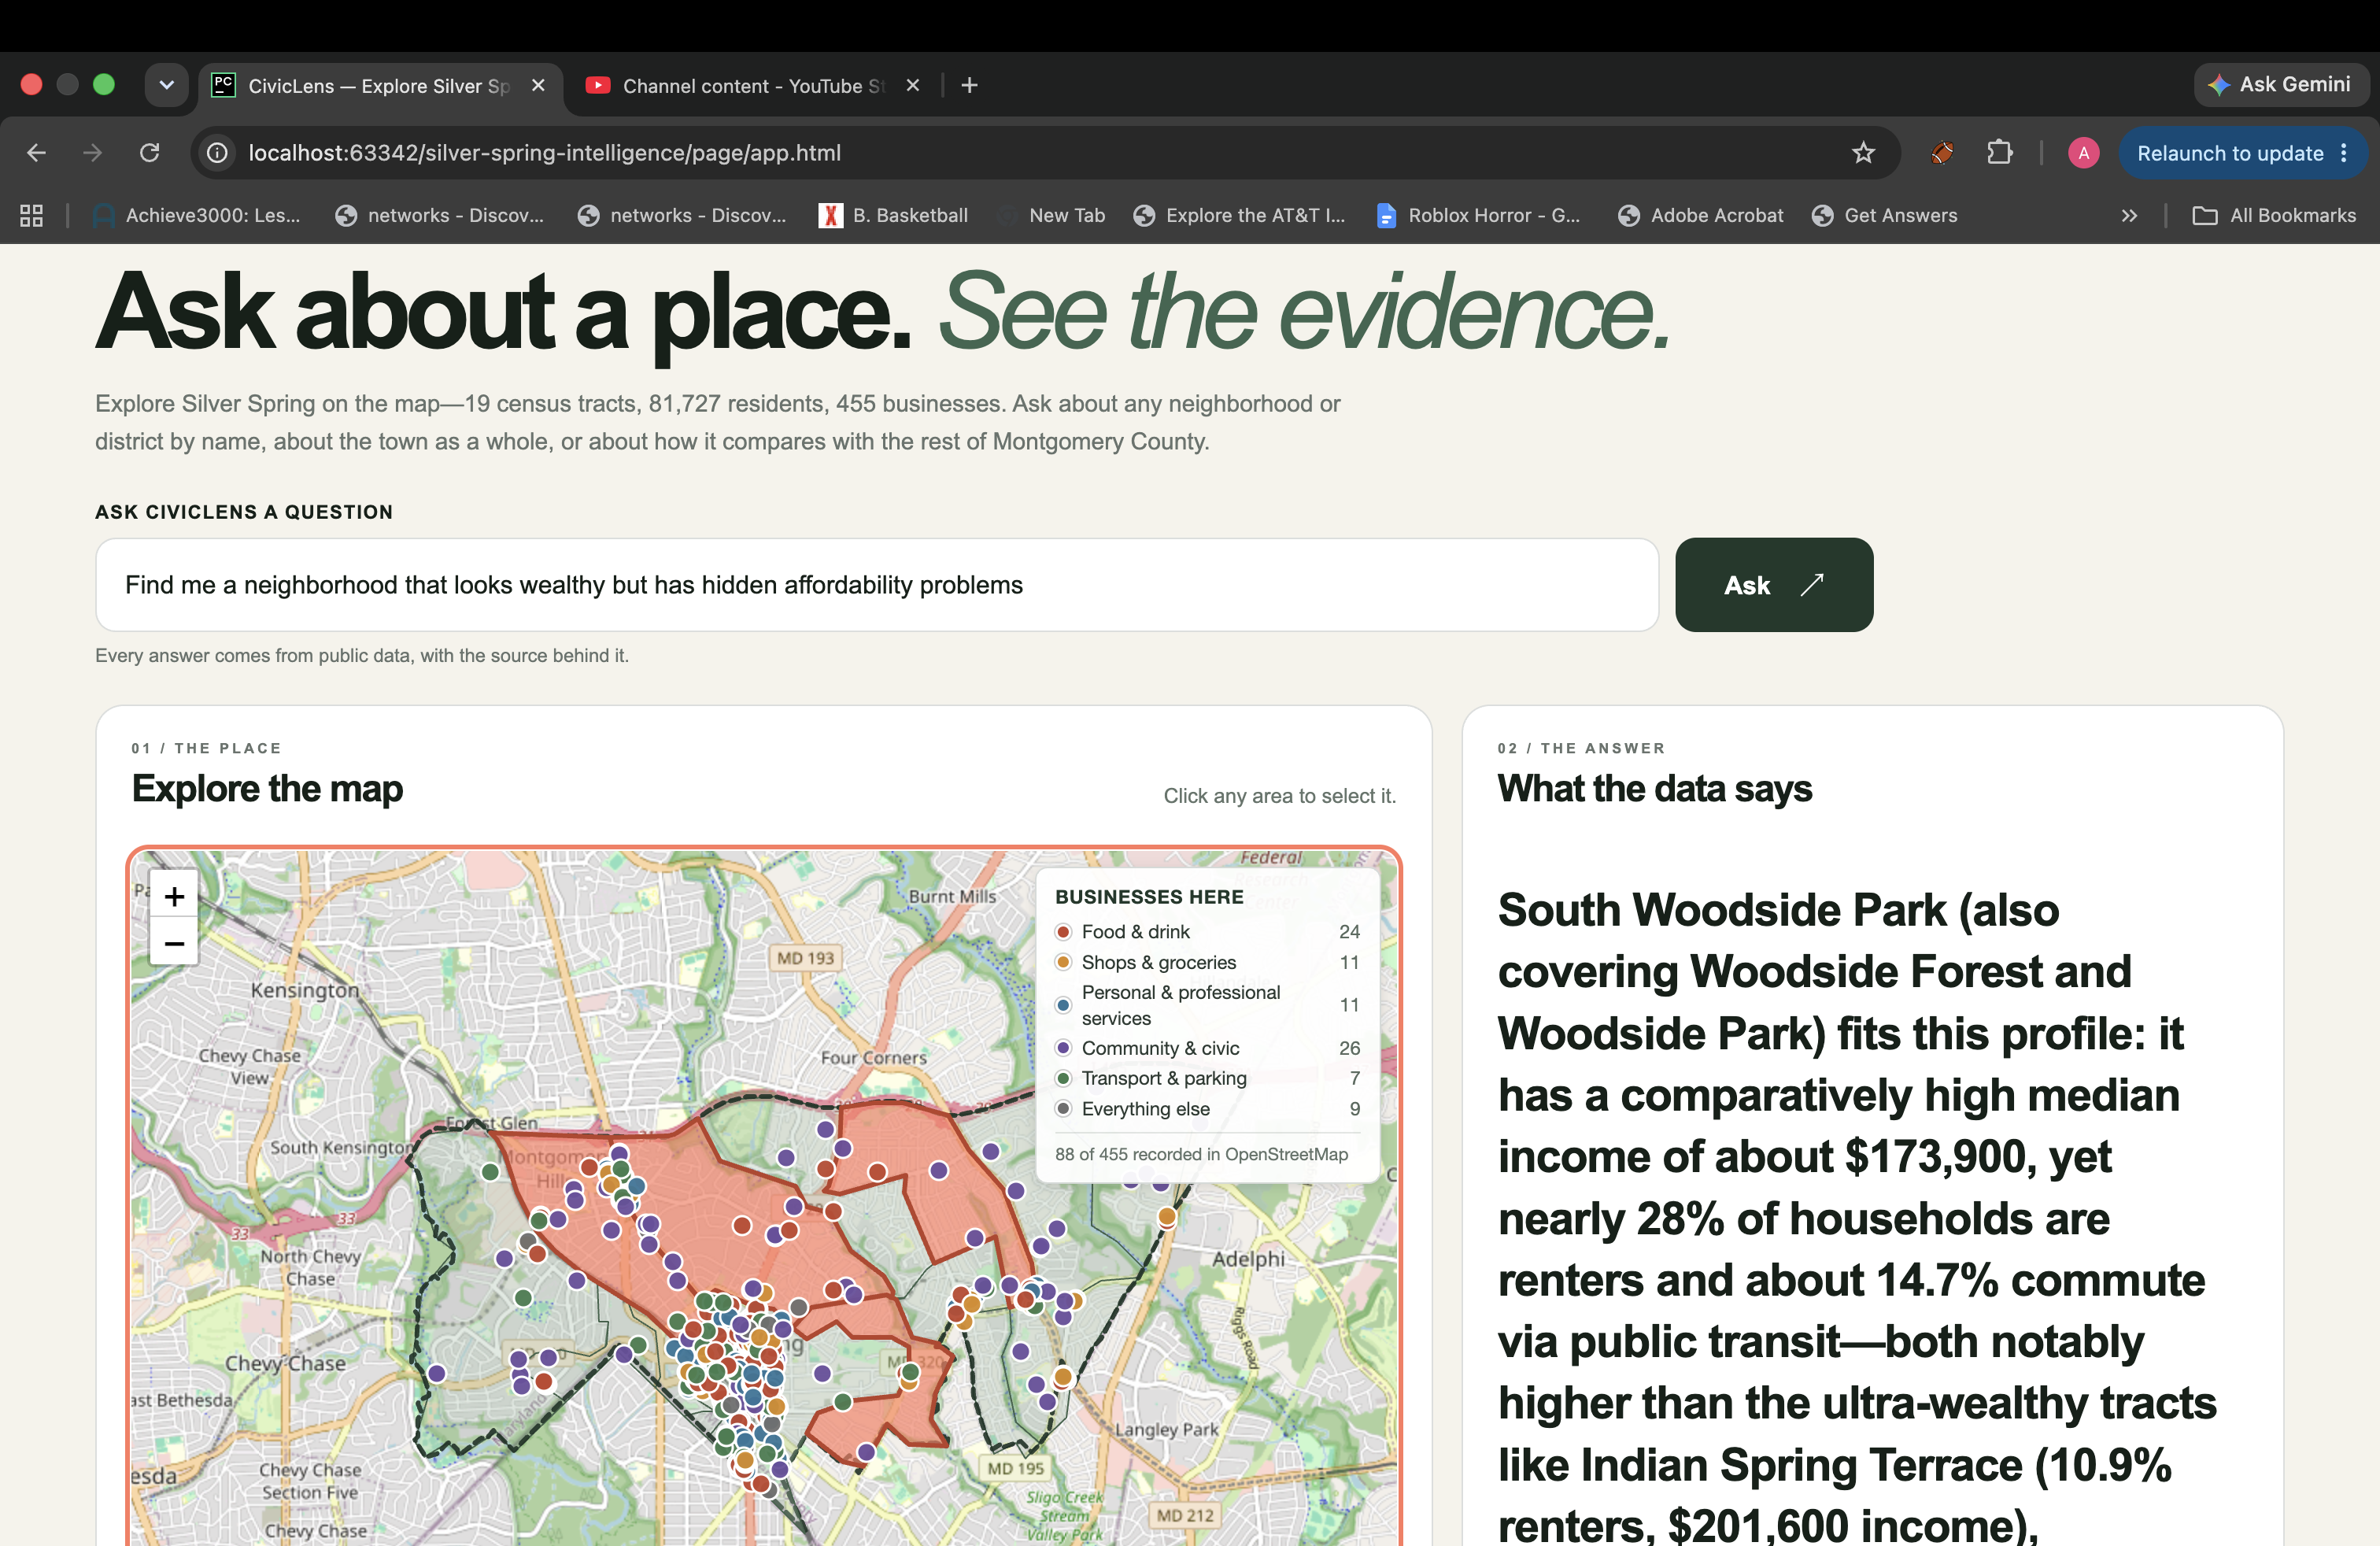
Ask a question in plain English and get an answer with its source.
Inspiration
A shop owner on Fenton Street in Silver Spring wants to know something simple: who lives within walking distance of my door, and is that changing?
The answer is public. It's sitting in the American Community Survey right now. But getting it means knowing your neighborhood is spelled 24031702502, that income lives in table B19013, and that the number you want is B19013_001E. The data isn't missing. It's unusable by the people it describes.
So we built the translation layer.
What it does
You ask the way you'd say it out loud — Who lives in Woodside? What businesses are in Fenton Village? Where is the most affordable housing? How has transit commuting changed?
CivicLens answers in a sentence, highlights the area on the map, shows the rows behind the number, and cites the exact published table it came from — not "the Census," but ACS 5-Year 2020–2024, Table B19013, opened on the same geography the answer covers.
It covers Silver Spring: 19 census tracts, 81,727 residents, 455 businesses, and ~60 named neighborhoods. The database holds all 232 tracts in Montgomery County, so "compared with the rest of the county" is a real query.
How we built it
The model writes the query. The database produces the numbers.
Claude never states a figure. It translates English into a SQL SELECT, which is validated, run read-only, and the returned rows are the answer. Claude then phrases a sentence using only those rows. If it can't write a valid query, it says so.
That's the whole reason the output is trustworthy. A model that writes numbers can hallucinate one. A model that writes a query cannot — the query either runs or it doesn't.
Four public sources, all pulled during the hackathon: Census ACS for every tract in Montgomery County; Census TIGER/Line boundaries; 5,953 OpenStreetMap businesses, each placed in its tract by a point-in-polygon test we wrote by hand (ray casting, no geospatial libraries); and the official Silver Spring CBD polygon from Montgomery County Planning.
We store raw counts only — no composite scores, no hidden weights — and every row keeps its source, which is the only reason the citations can exist.
We checked our own work. Re-querying the Census API at county level, our 232 tracts sum to 1,004,869 residents age 5+ with 573,273 speaking only English at home — exactly, to the person, what the Bureau publishes.
Naming places the Census doesn't. The Census publishes tracts, not neighborhoods, so "Lyttonsville" has nothing to join to. We resolve OpenStreetMap places to their containing tract. The downtown districts — Fenton Village, Ellsworth, Ripley, Falklands — don't exist as data anywhere (searching ArcGIS Online for "Fenton Village" returns zero results; they're figures in a PDF). We locate each from its namesake street, clipped to the official CBD so Fenton Street running to Takoma Park doesn't drag the district with it. Every place records how it was located.
What we found
Fenton Village holds 204 businesses, 76 of them restaurants — 13.1% of Silver Spring's people and 44.8% of its businesses, at 3.4× the business density of the county.
But the point of the tool is that it answers the same question anywhere. Ask where the cheapest housing is and it names Kilmarock at $47,227, against $201,591 in Brookside Forest — a 4.3× income gap between neighborhoods about two miles apart, across 63 named places, none of which the Census labels by name.
Ask what's changing and it reaches a second ACS vintage: public transit commuting in Silver Spring fell from 24.6% of commuters in 2016–2020 to 13.8% in 2020–2024 — in a downtown built around a Metro station.
Challenges we ran into
- Median income came back as $250,001 everywhere — the Census top-code for "higher than we publish," not a value. Excluding it revealed the real spread: $47,227 to $201,591.
- The language data was silently empty. We'd pulled B16001, which isn't published at tract level. Zero of 232 tracts had data and nothing errored.
- ACS 2019 couldn't be used for trends — it predates the 2020 tract redraw, so the geoids don't line up.
- A citation that looked like a contradiction. Our answer said 42,944 speak only English; the Census link opened on one tract showing 760. Our figure sums 19 tracts and data.census.gov shows one at a time — so citations now state their arithmetic.
- One trailing slash 404'd the entire frontend while the API was perfectly healthy.
What we learned
We're freshmen, and two of us had never used git before Friday.
The technical lesson: an empty column is more dangerous than an error. The language data was blank for hours while every piece of code reported success. Nothing crashes when a query returns zeroes. We started writing invariant checks — is every row populated, does every business have a tract — and caught things no test of ours would have.
The design lesson: "cite your sources" isn't a feature, it's a constraint that has to hold at every layer. If the ingest doesn't record where a row came from, no polish downstream can put it back.
The API runs on Render's free tier and sleeps after 15 minutes idle — the first request takes ~30 seconds to wake.
Built With
- american-community-survey
- anthropic
- census-api
- claude
- css
- esri
- fastapi
- geojson
- html
- javascript
- leaflet.js
- openstreetmap
- overpass-api
- python
- render
- rest-api
- sqlite
- text-to-sql
- tiger-line
- uvicorn

Log in or sign up for Devpost to join the conversation.