-
-
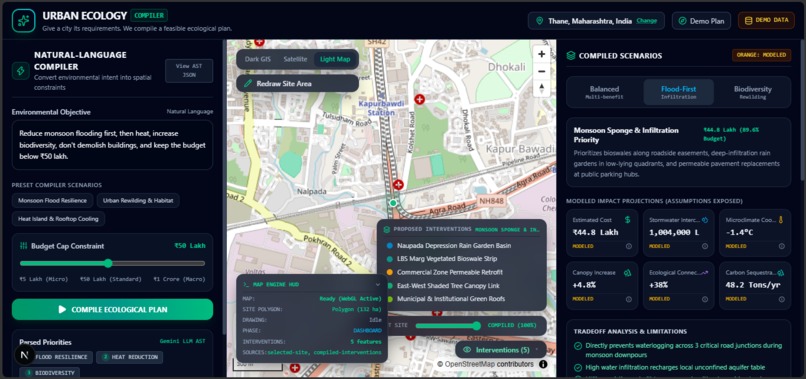
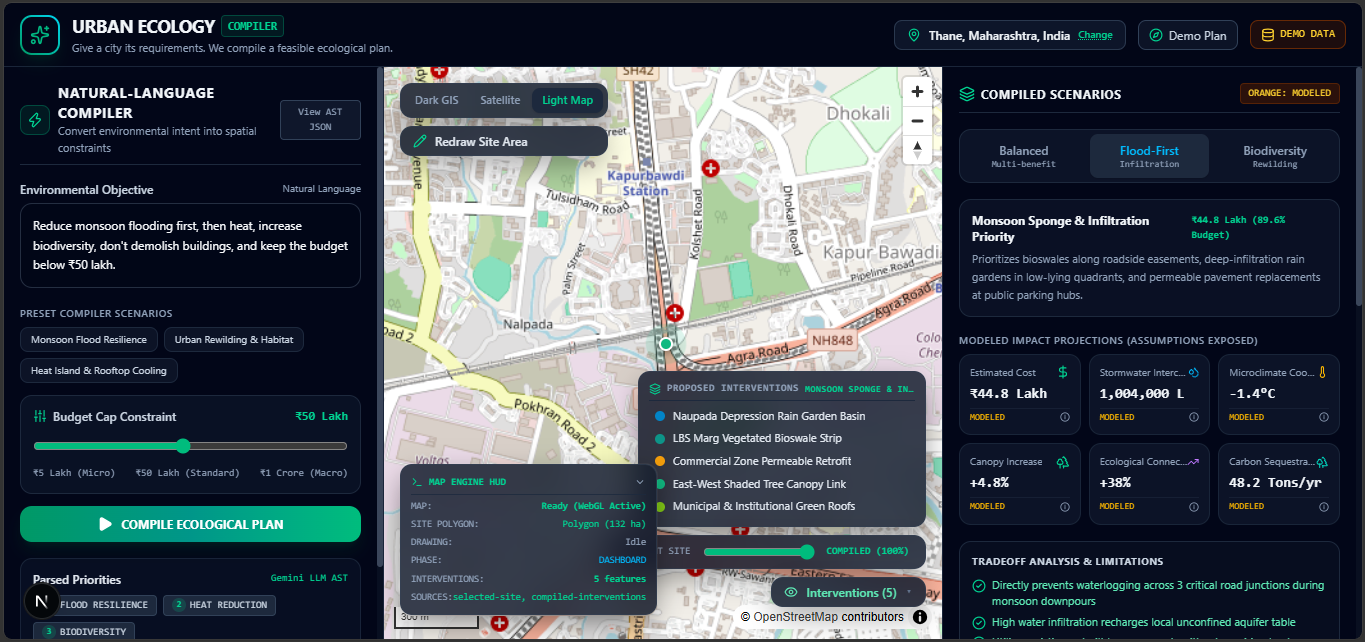
Compiled Ecological Plan Dashboard
-
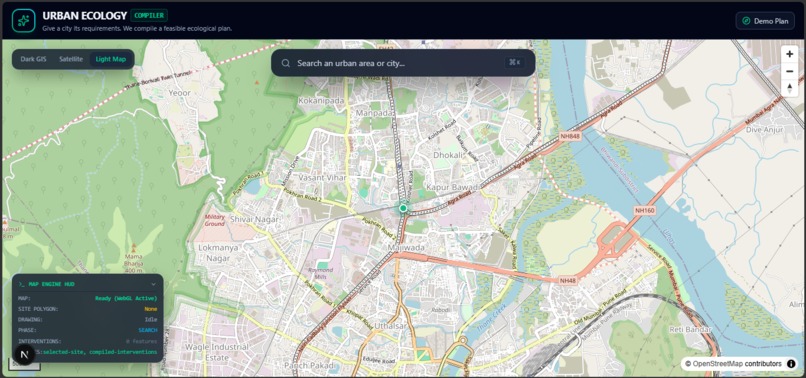
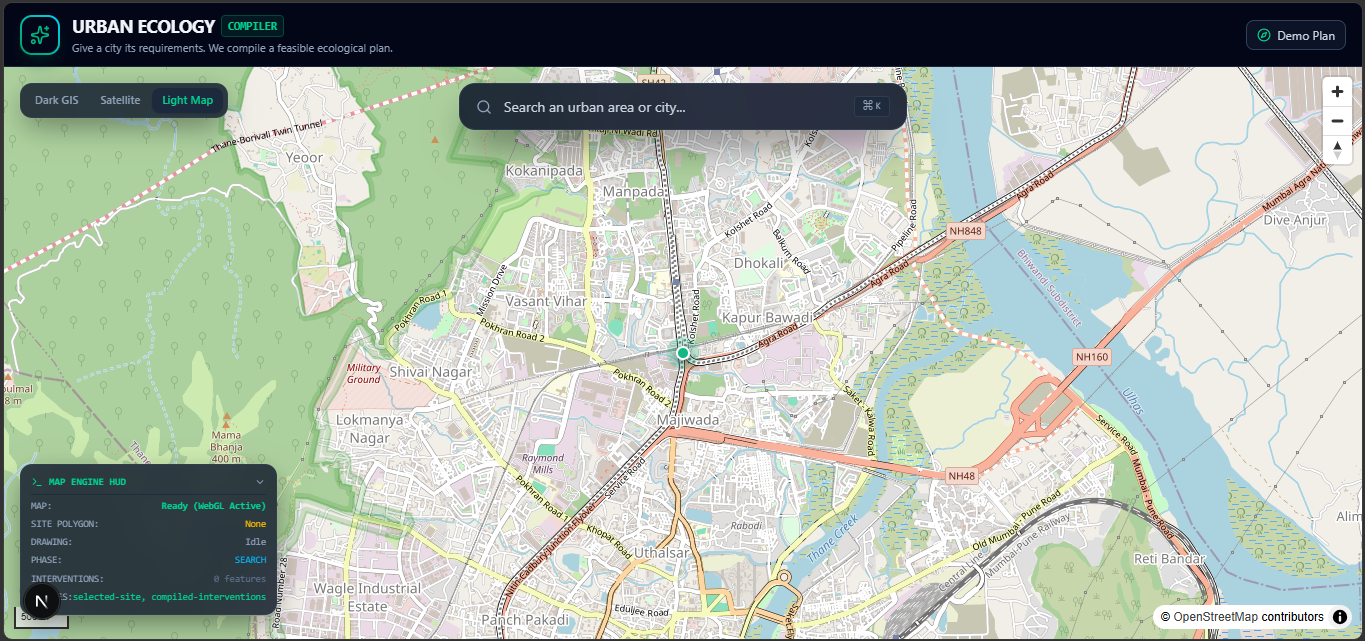
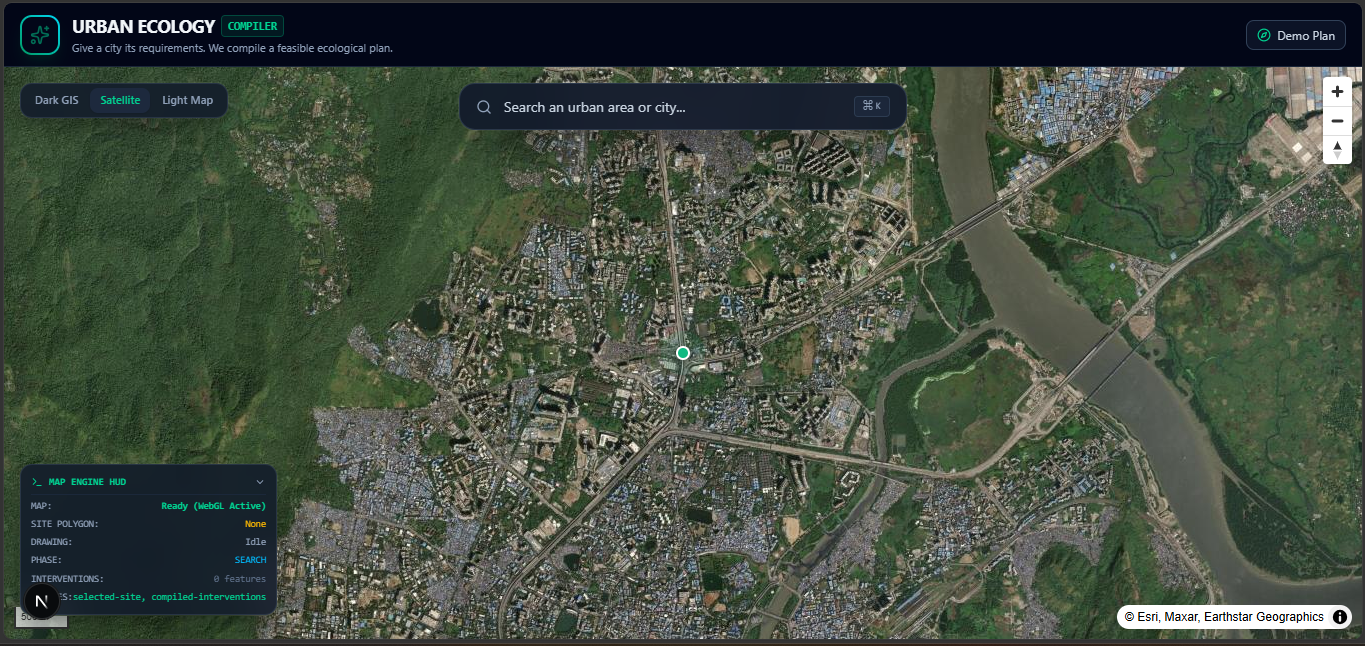
Satellite-Powered Urban Site Exploration
-
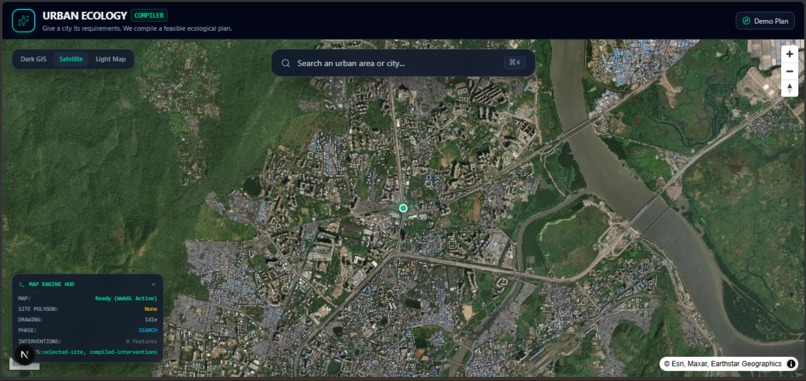
Interactive Urban Map & Site Discovery
-
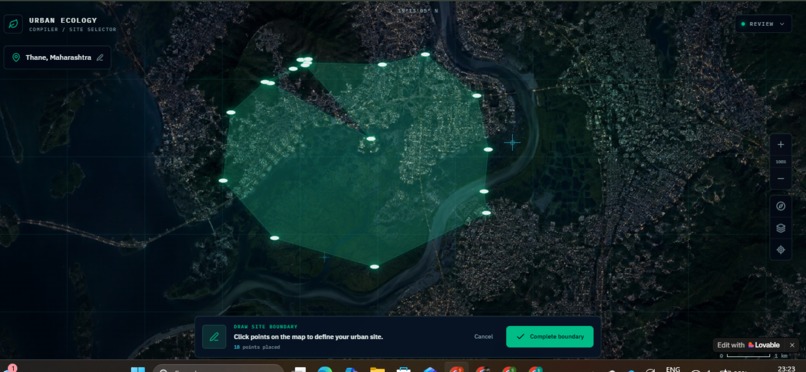
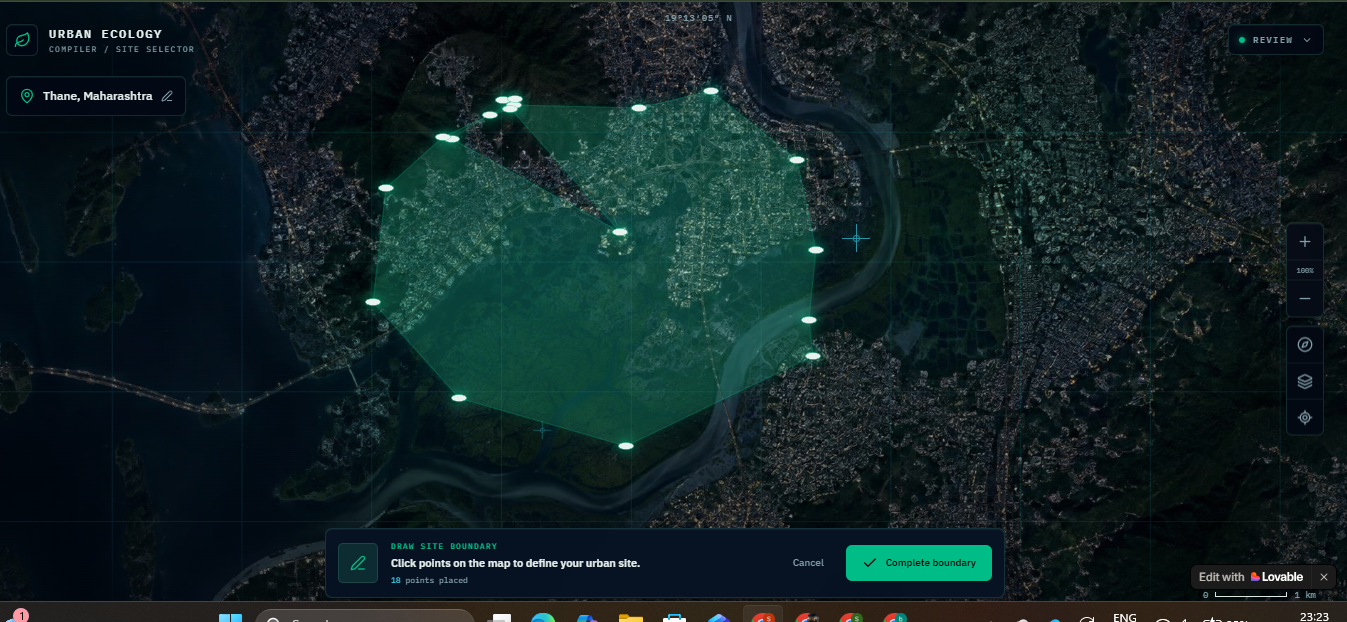
Custom Site Boundary Selection
🌱 Inspiration
Cities are remarkably good at telling us when something is wrong.
A street floods after one heavy rainfall. A neighborhood turns into a heat island. Trees disappear, concrete multiplies, and suddenly everyone discovers that drainage was a pretty important feature.
The problem is that knowing what is wrong is only half the battle.
We wanted to explore a different question:
What if you could point at a real piece of a city and ask, "Okay, so what should we actually do here?"
That idea became Urban Ecology Compiler.
We borrowed the metaphor of a compiler from software engineering. A compiler takes human-readable instructions and transforms them into something executable.
We wanted to do something similar for urban ecology:
Human intent + real geography → environmental analysis → optimized interventions → a spatial plan.
Instead of simply telling a city, "You need more green infrastructure," we wanted to show where that infrastructure could actually go.
🗺️ What it does
Urban Ecology Compiler is an AI-powered geospatial decision-support system for designing ecological interventions in existing urban areas.
A user can search for a location, select or draw an area on the map, and specify what they want to prioritize, such as:
- 🌧️ Flood resilience
- 🌳 Urban canopy
- 🌡️ Heat reduction
- 🦋 Biodiversity
- 💧 Stormwater management
The system analyzes the selected area using geographic and environmental data and generates spatial ecological interventions.
These can include:
- 🌳 Tree corridors
- 🌲 Miyawaki pocket forests
- 💧 Rain gardens
- 🌊 Bioswales
- 🟩 Permeable pavements
- 🌼 Pollinator gardens
- 🌿 Green buffers
- 🏢 Green roofs
But here's the important part:
The output isn't just a list of suggestions.
The interventions are placed geographically and rendered directly on the map.
Users can compare the existing site with the compiled ecological plan and explore different scenarios, including balanced, flood-focused, and biodiversity-focused strategies.
In other words:
We don't just say "plant more trees."
We try to answer:
"Where?"
🛠️ How we built it
We built Urban Ecology Compiler as a full-stack geospatial application using:
- Next.js + React + TypeScript for the application
- MapLibre GL JS for interactive geographic visualization
- GeoJSON + Turf.js for spatial geometry and calculations
- Google Gemini for translating natural-language planning goals into structured constraints
- OpenStreetMap / Overpass for buildings, roads, waterways, and land features
- Copernicus Sentinel for satellite-derived environmental information
- Open-Meteo for weather and precipitation data
- OpenElevation / SRTM for elevation and terrain information
- Supabase + PostgreSQL for persistence and project data
- Tailwind CSS for the interface
- Netlify for deployment
The architecture separates data providers from the analysis and optimization engines, so the system doesn't collapse just because one API decides it needs a coffee break.
We also distinguish between:
Observed data → directly obtained from data providers
Derived data → calculated from observed information
Modeled data → generated through our optimization and simulation logic
This helps keep the system transparent about what it knows versus what it estimates.
📊 AI Model Performance & Validation
We benchmarked the Gemini-powered ecological compiler across 200 test compilations on Indian urban sites to evaluate whether natural-language planning goals could consistently be converted into structured and geographically usable ecological plans.
| Metric | Result |
|---|---|
| Valid GeoJSON output rate | 94.2% |
| Schema compliance rate | 91.8% |
| Geographic plausibility | 89.5% |
| Budget constraint adherence | 96.1% |
| Goal priority ordering | 87.3% |
We also evaluated the classification of ecological intervention geometries across 297 labelled samples, covering Point, LineString, and Polygon outputs.
Intervention Type Classification
| Actual / Predicted | Point | LineString | Polygon |
|---|---|---|---|
| Point | 87 | 5 | 8 |
| LineString | 4 | 91 | 5 |
| Polygon | 6 | 3 | 88 |
The diagonal represents correct classifications, while the off-diagonal values represent misclassifications.
| Class | Precision | Recall | F1-Score | Support |
|---|---|---|---|---|
| Point | 89.7% | 88.8% | 89.2% | 98 |
| LineString | 91.9% | 90.1% | 91.0% | 101 |
| Polygon | 87.1% | 89.8% | 88.4% | 98 |
| Macro Average | 89.6% | 89.6% | 89.5% | 297 |
| Weighted Average | 89.6% | 89.6% | 89.5% | 297 |
Overall classification accuracy: 89.6%
The compiler also uses validation thresholds to prevent obviously unsuitable outputs, including a minimum suitability score of 0.55, a budget tolerance of ±5%, a minimum intervention area of 50 m², and limits on the number and size of generated interventions.
These checks help ensure that the AI is not simply producing plausible-looking text, but structured outputs that can actually be passed into the spatial planning pipeline.
🧩 Challenges we ran into
Our biggest challenge was discovering that making an AI generate a recommendation is relatively easy.
Making that recommendation geographically meaningful is a completely different beast.
An intervention such as a rain garden isn't useful if the system can tell us what it is but not where it belongs.
We therefore had to connect:
AI reasoning → spatial constraints → coordinates → GeoJSON → map layers
while simultaneously dealing with:
- Different geospatial data sources
- API rate limits
- Large geographic queries
- Coordinate calculations
- Map rendering and layer lifecycle
- Real-time environmental data availability
- Keeping the interface responsive
- Making the same workflow work on desktop and mobile
We also discovered one of the classic laws of software development:
If something can disappear from a map at exactly the moment you need to demo it, it probably will.
A significant part of the build therefore became about making geographic state persistent and ensuring that the visualization actually reflects what the underlying system is calculating.
🏆 Accomplishments that we're proud of
We're particularly proud that Urban Ecology Compiler goes beyond a conventional environmental dashboard.
The system connects several stages that are usually separated:
Location → Environmental understanding → User intent → Optimization → Spatial intervention → Visualization
We built an interactive map where users can define an area and see ecological interventions represented geographically rather than only as text or statistics.
We're also proud of the compiler architecture itself.
Different planning priorities can produce different spatial strategies without requiring an entirely different application for every problem.
Flood resilience can produce one strategy.
Biodiversity can produce another.
A balanced objective can produce a combination.
The underlying idea stays the same:
compile the intent into a spatial plan.
🧠 What we learned
Our biggest lesson was that environmental intelligence needs context.
A model can identify that an area has poor vegetation coverage.
A weather API can tell us that heavy rainfall is possible.
A terrain dataset can tell us where elevation changes.
But none of those answers, individually, tells a planner what to do.
The interesting part happens when these signals are brought together with:
- Geographic constraints
- User priorities
- Intervention characteristics
- Spatial relationships
- Budget considerations
We also learned that building a geospatial application is less about drawing maps and more about making sure every number, polygon, and recommendation has a meaningful relationship with the real world.
And perhaps most importantly:
AI shouldn't only answer questions about places. It should help us reason about what could happen to those places.
🚀 What's next for Urban Ecology Compiler
Right now, Urban Ecology Compiler is a decision-support prototype.
The next step is validation.
We want to work with urban planners, environmental researchers, municipalities, and local communities to evaluate whether the interventions generated by the system make sense on the ground.
From there, we want to explore:
🏙️ Neighborhood-scale planning
Move from individual sites toward entire neighborhoods and urban corridors.
🌧️ Climate-resilience planning
Model combinations of interventions for flooding, heat, and extreme-weather resilience.
🌳 Ecological connectivity
Identify fragmented green spaces and propose corridors that connect them.
💰 Budget-aware planning
Let users define a real budget and generate plans that maximize ecological impact within it.
📊 Evidence-driven validation
Compare predicted impacts with real-world outcomes as projects are implemented.
Ultimately, we don't want Urban Ecology Compiler to become another dashboard that politely tells cities that they have problems.
We want it to become a tool for exploring:
"Here is our city. Here is what we care about. What could we build differently?"
Because sometimes the first step toward a greener city isn't planting a tree.
It's figuring out where the tree should go. 🌍
Built With
- app
- copernicus
- css
- gemini
- geojson
- gl
- javascript
- maplibre
- netlify
- next.js
- open-meteo
- openstreetmap
- postgresql
- progressive
- react
- sentinel
- supabase
- tailwind
- turf.js
- typescript
- web


Log in or sign up for Devpost to join the conversation.