-
-
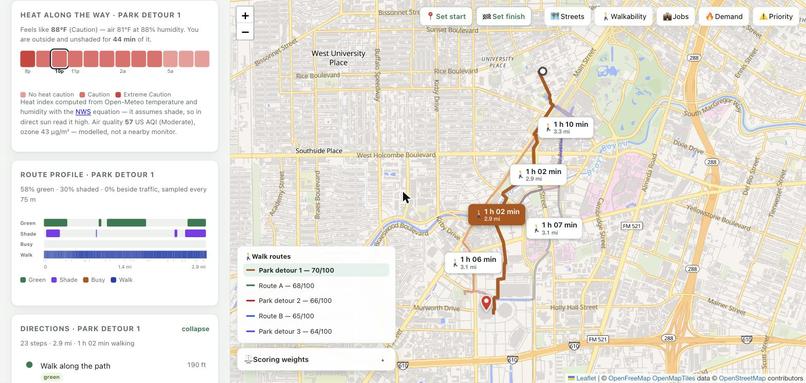
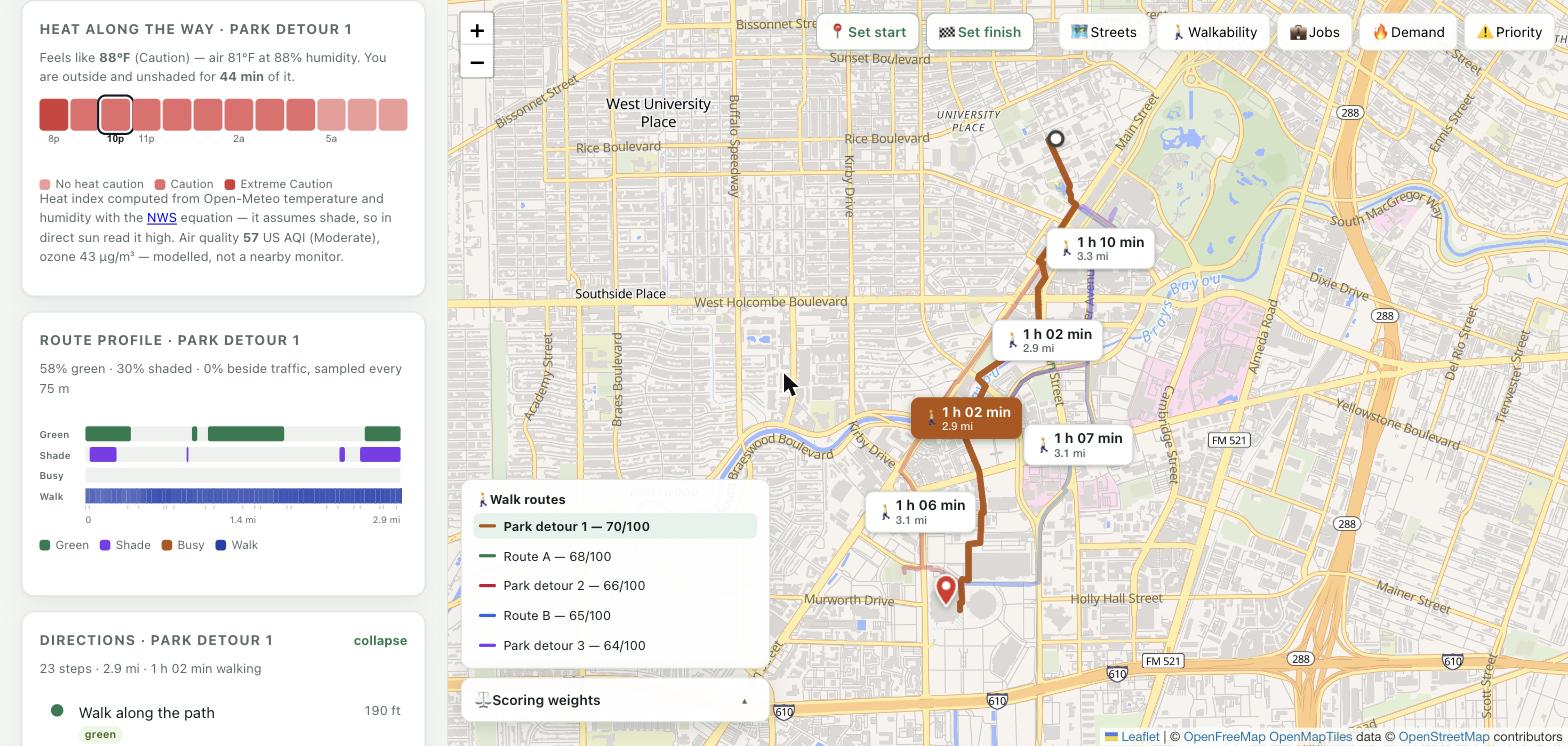
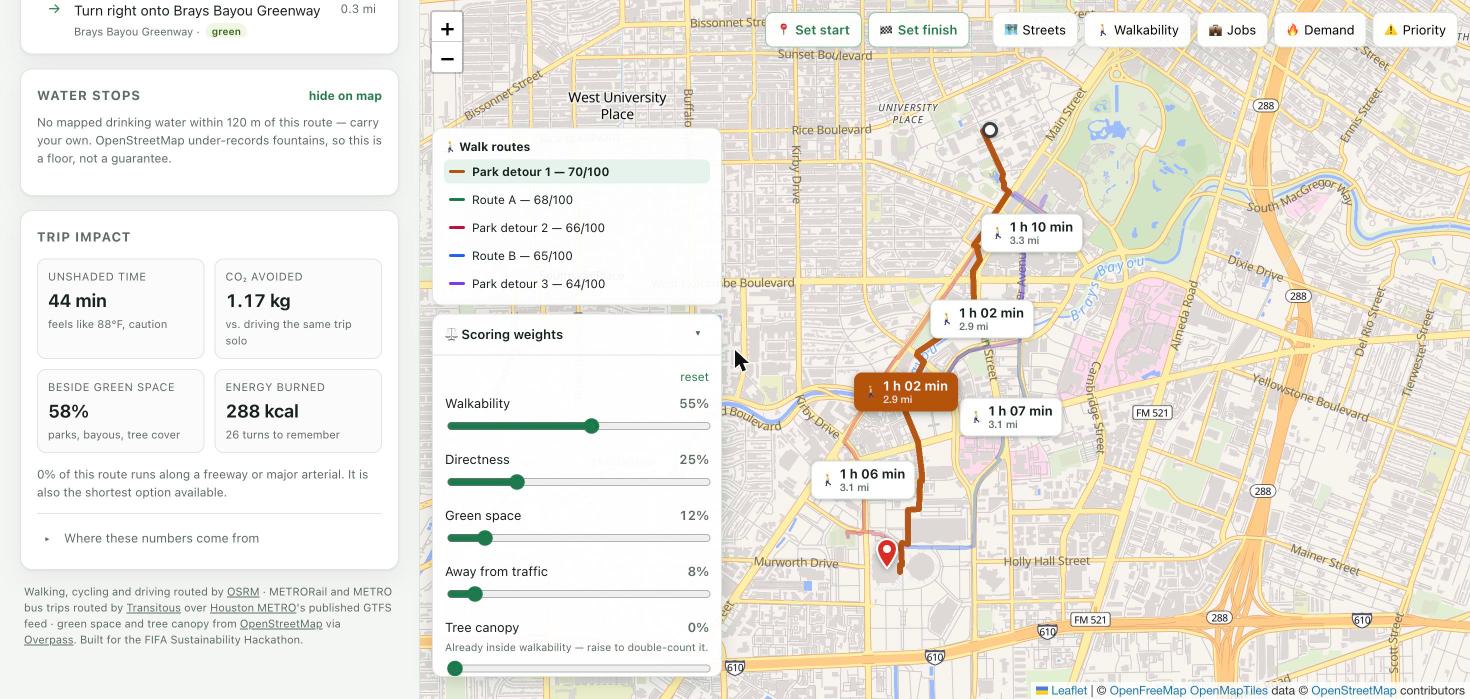
Planned at a time, so the heat is real: 88°F feels-like, computed here from the NWS equation. Below it, where the shade actually falls
-
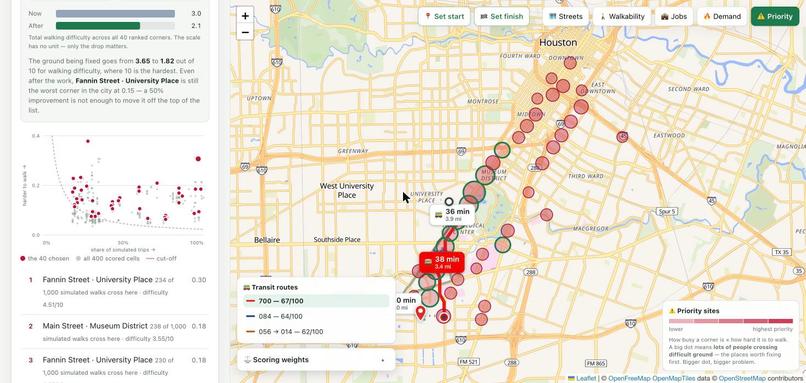
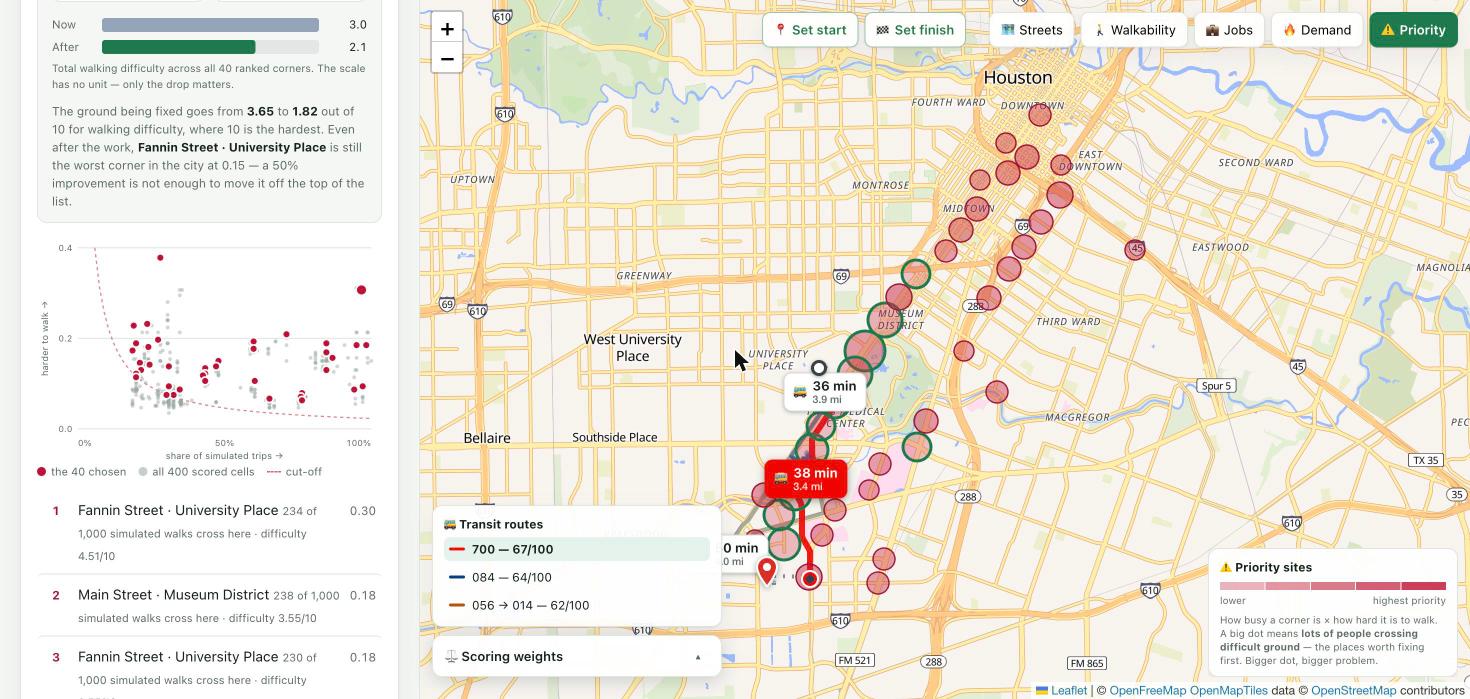
How the sites were chosen: all 400 scored cells, the 40 above the cut-off, and the ranking with its real numbers
-
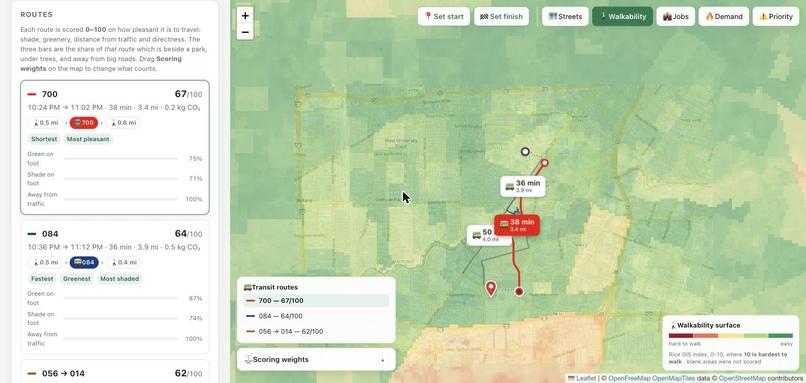
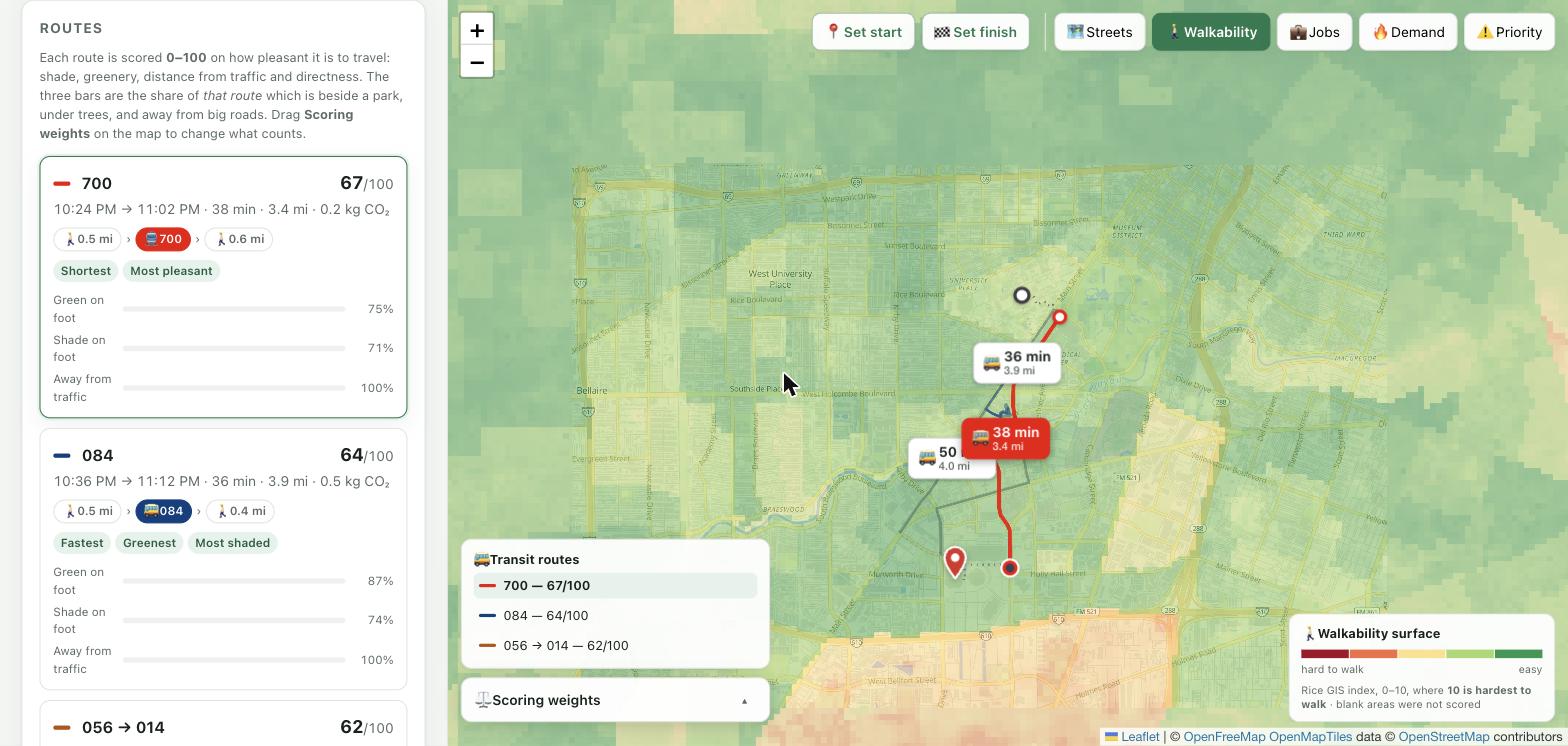
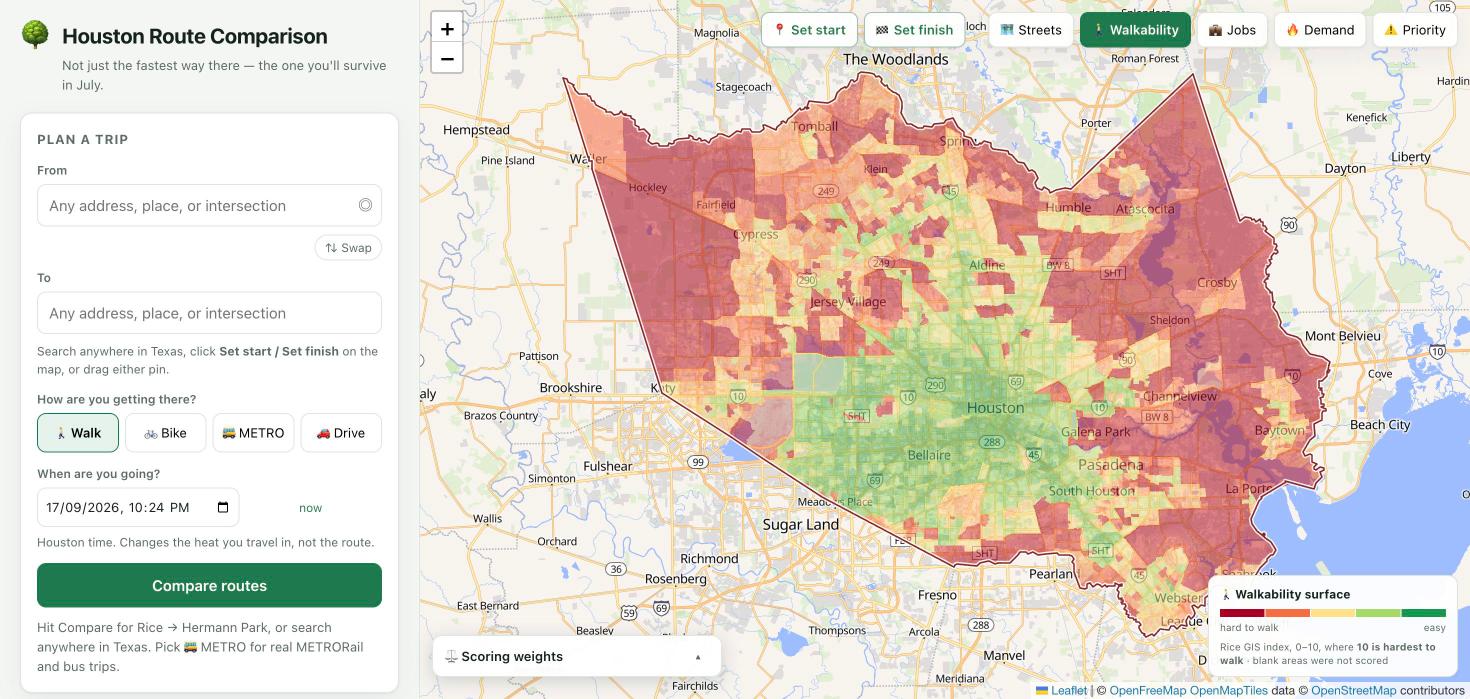
The GIS team's walkability surface under a live route: 30 m satellite and LiDAR data, and 55% of every score
-
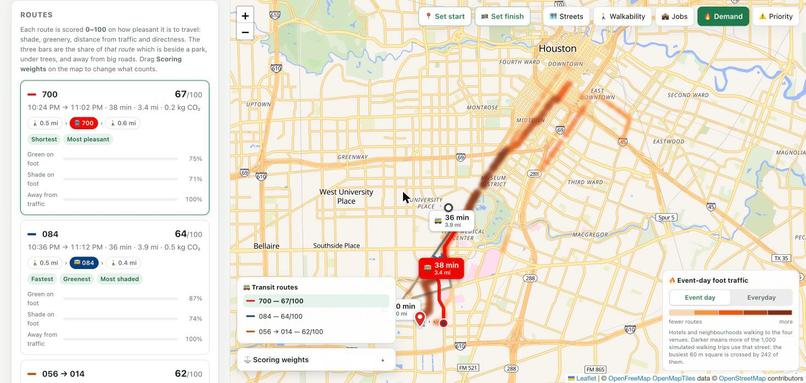
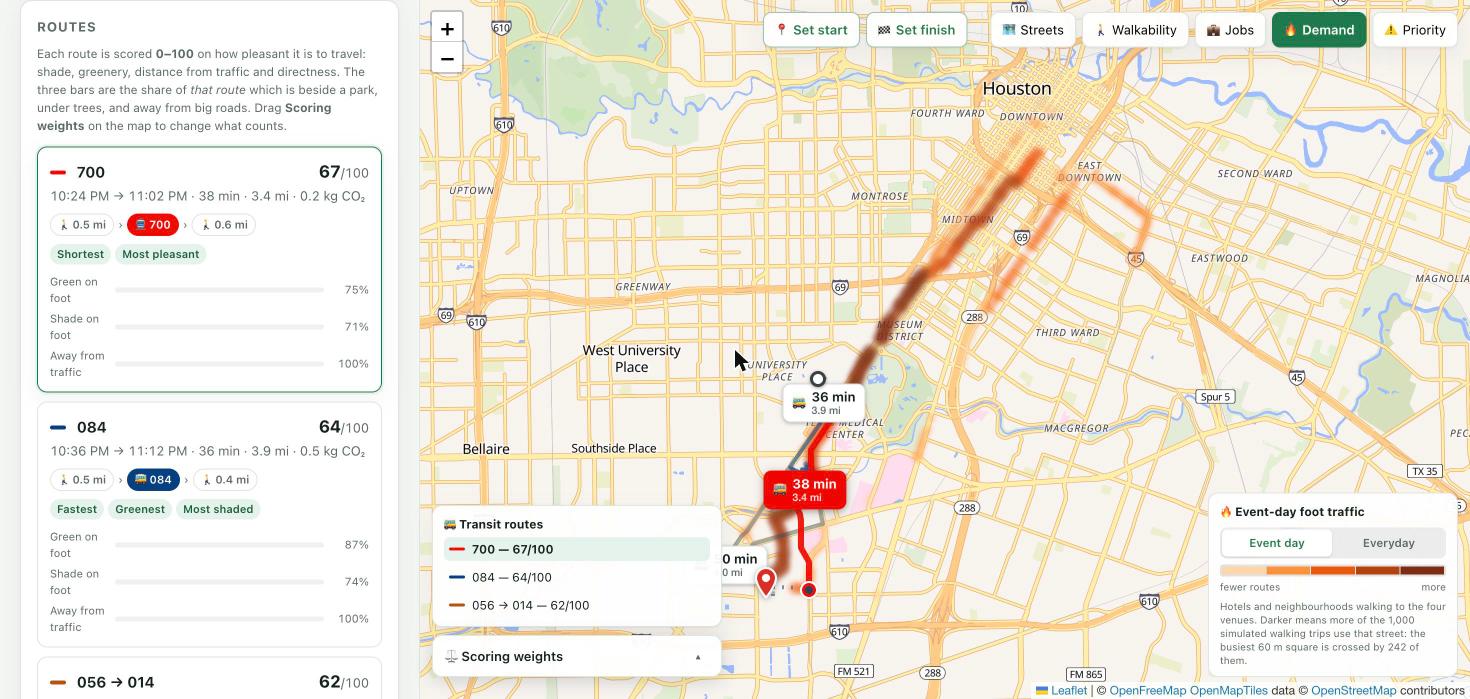
Event-day demand. 1,000 simulated walks to the venues; the busiest 60 m square carries 242 of them
-
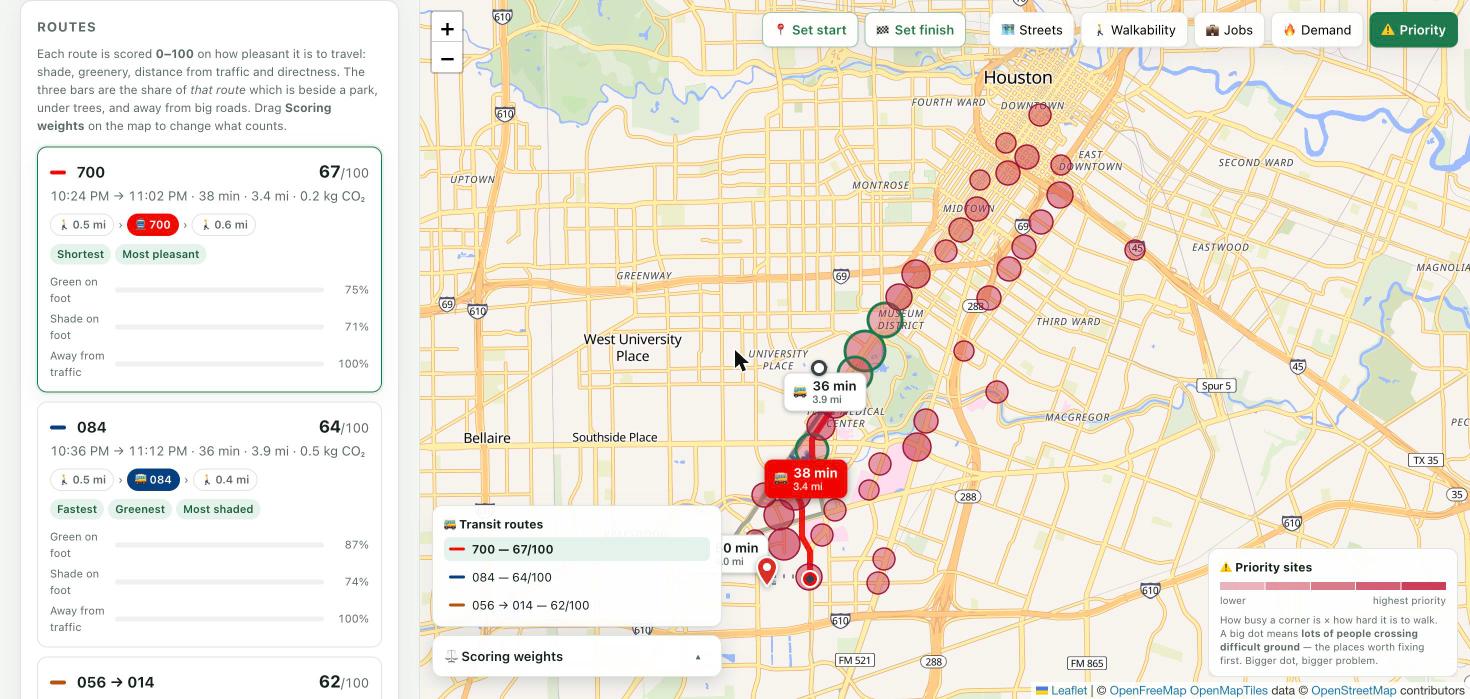
Cross demand with difficulty and you get priority: busy ground that's also hard to walk. Forty ranked sites
-
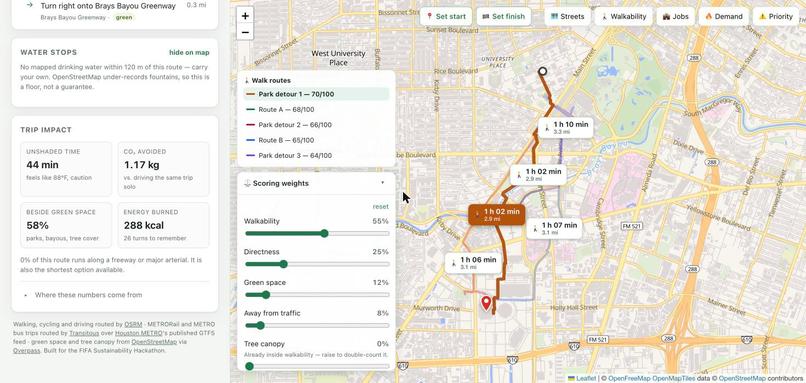
What the trip costs you, and the five weights behind the score. Tree canopy sits at 0% on purpose
-
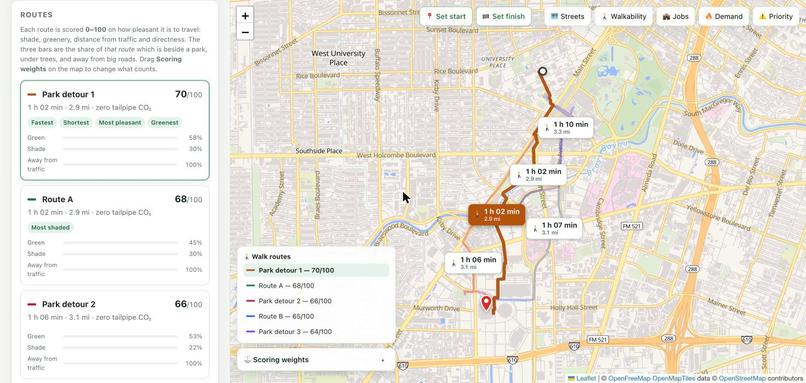
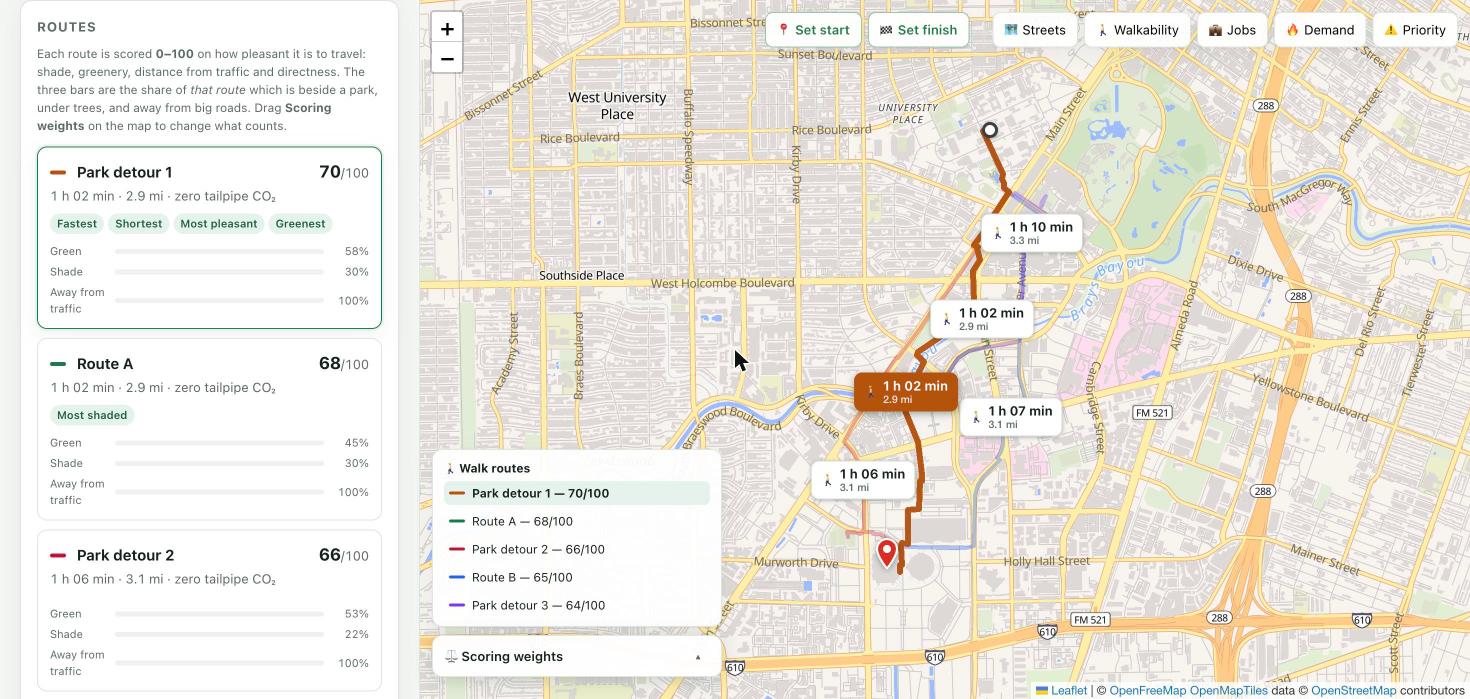
Five genuinely different ways from Rice to NRG, scored 0–100 on shade, greenery, traffic and directness
-
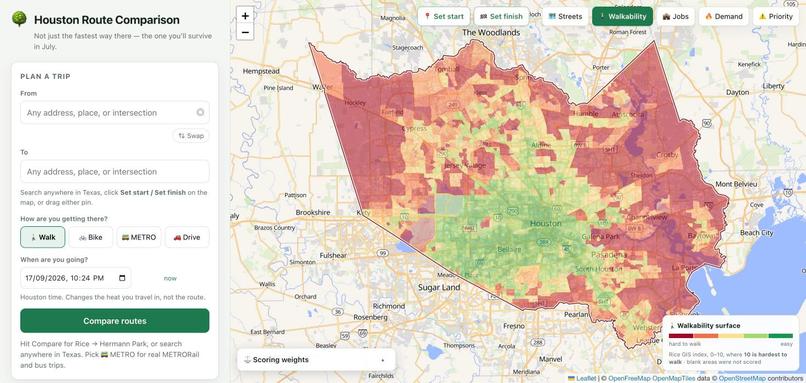
The whole county. A walkable green core, deep red at the edges and down the Ship Channel
-
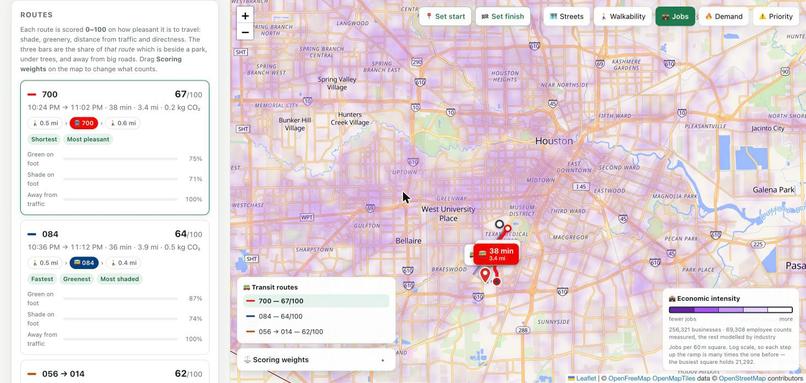
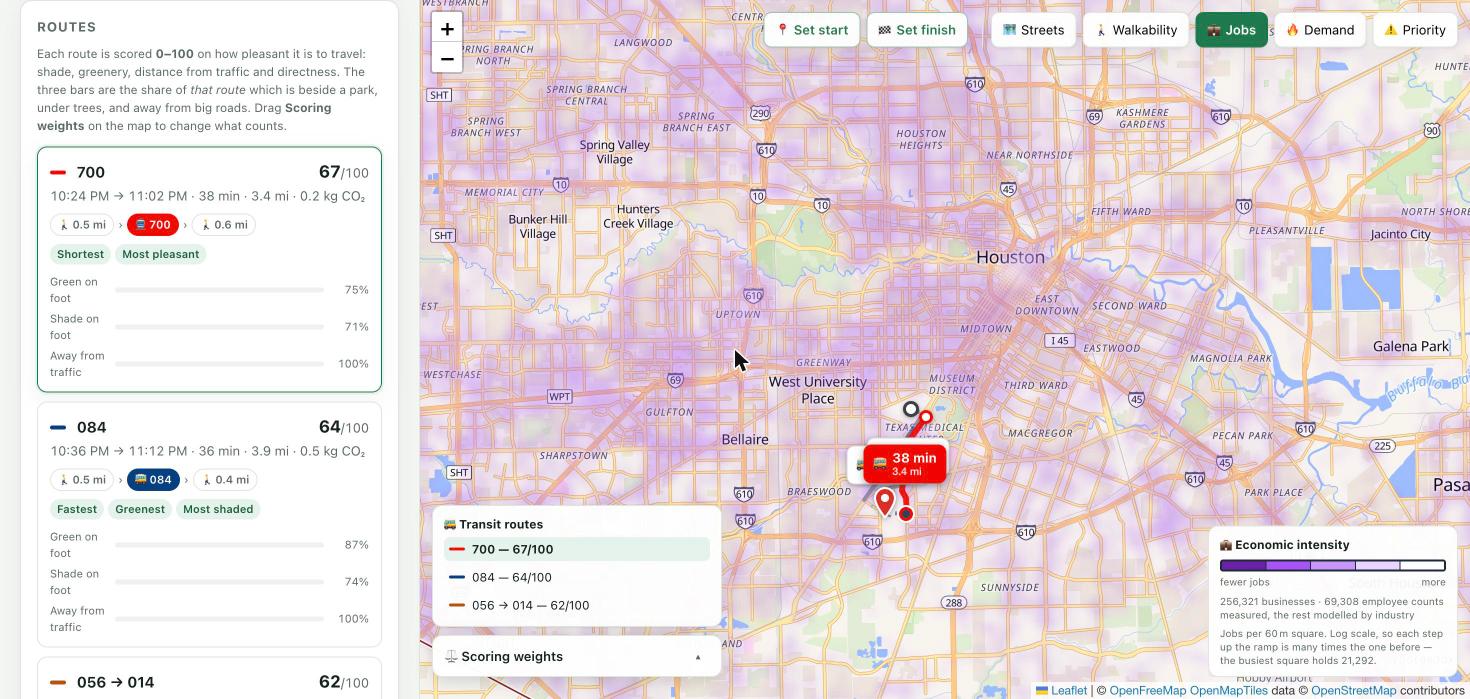
Economic intensity: 256,321 Harris County businesses aggregated to jobs per 60 m square
-
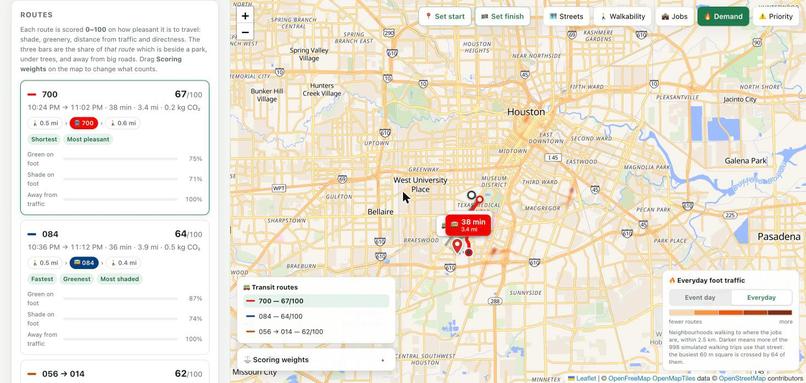
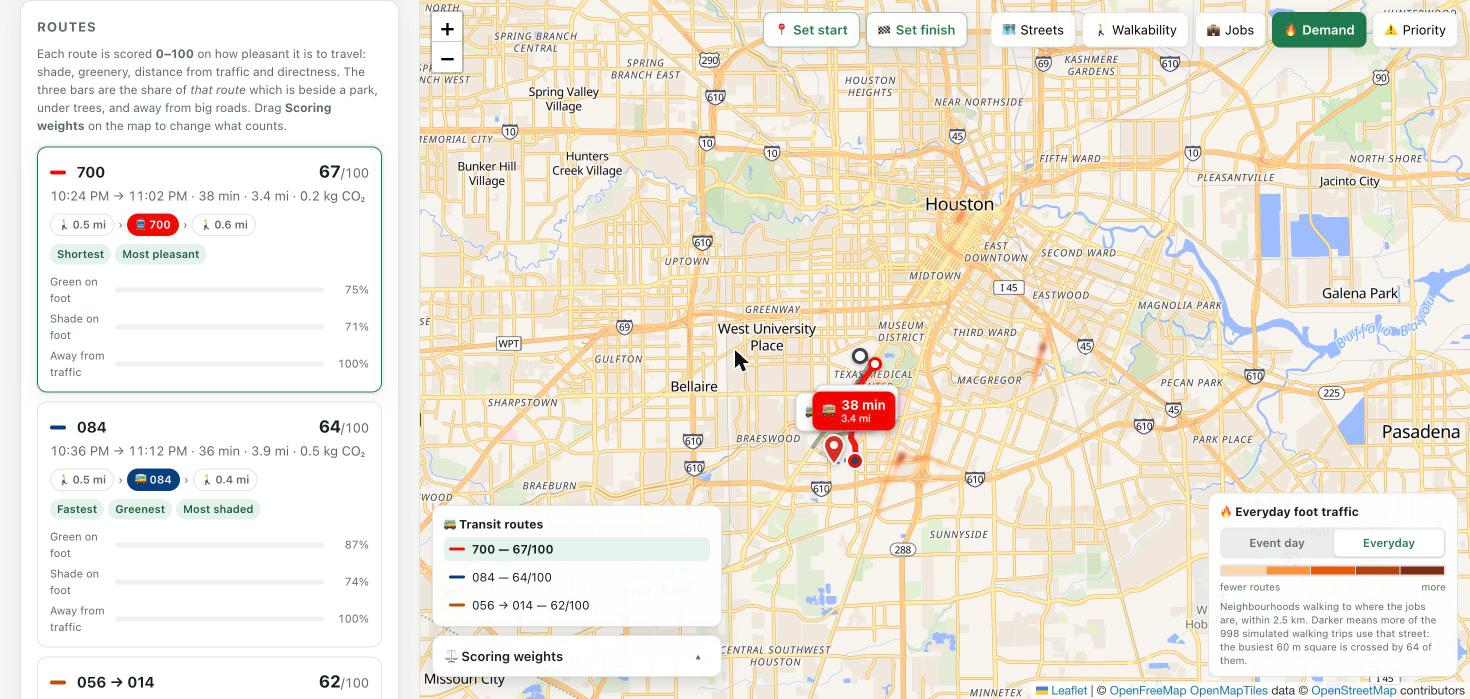
Everyday demand. Same city, ordinary Tuesday — and a completely different set of corridors
-
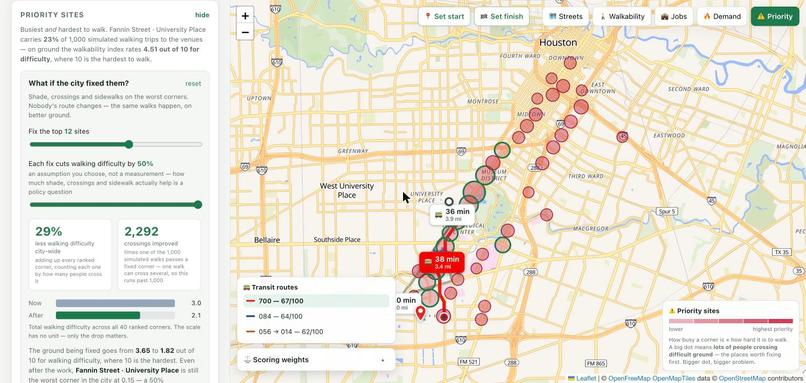
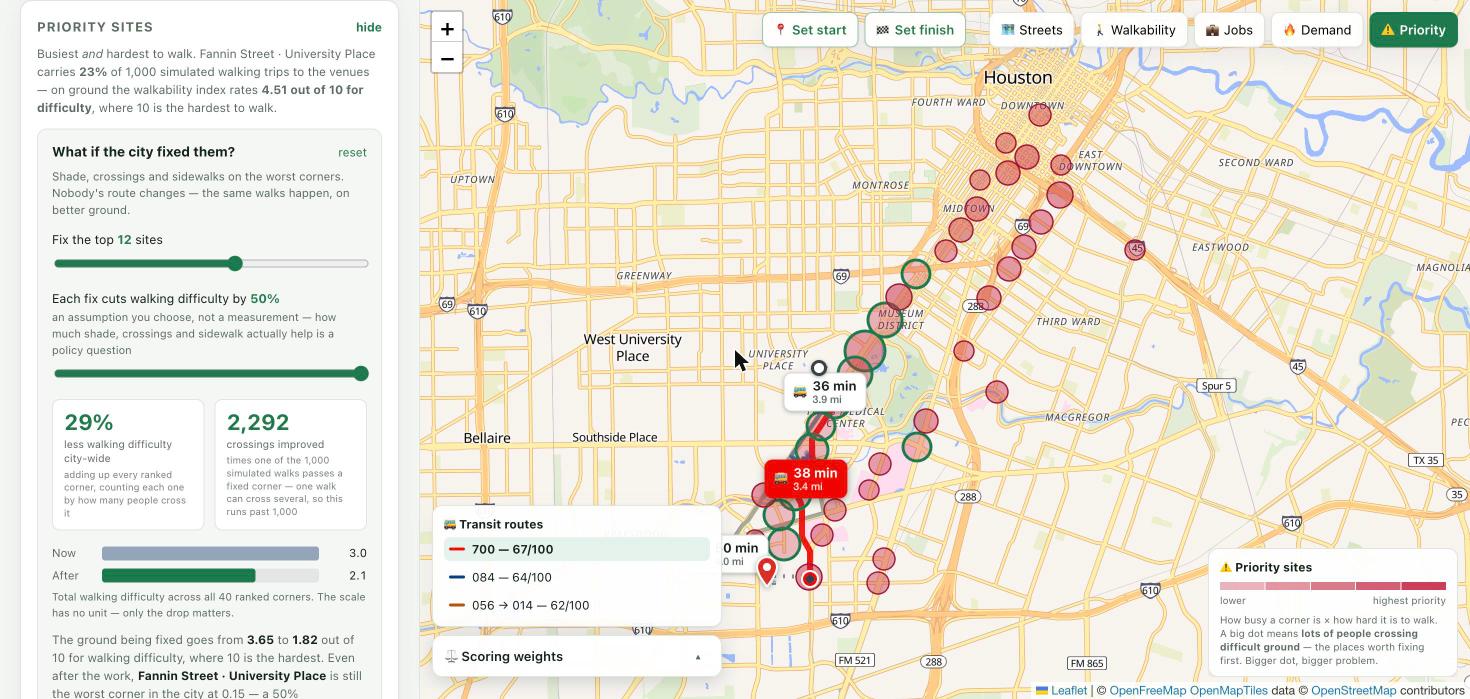
The lever. Fix the top 12 corners and 29% of the city's walking difficulty goes with them, across 2,292 crossings
-
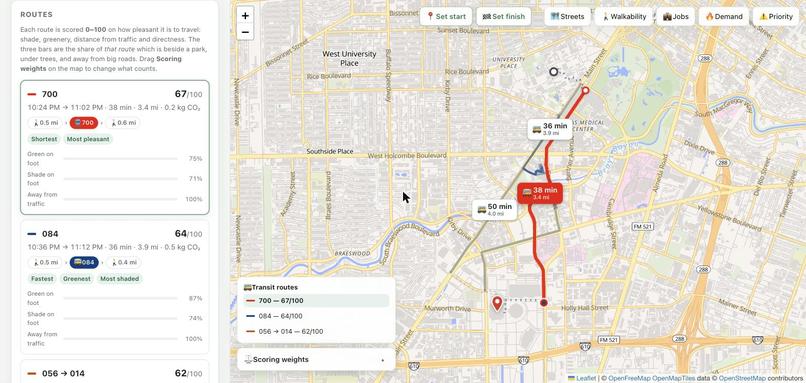
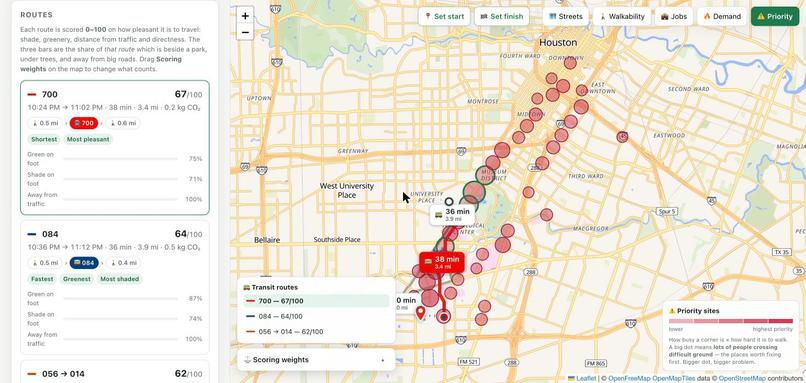
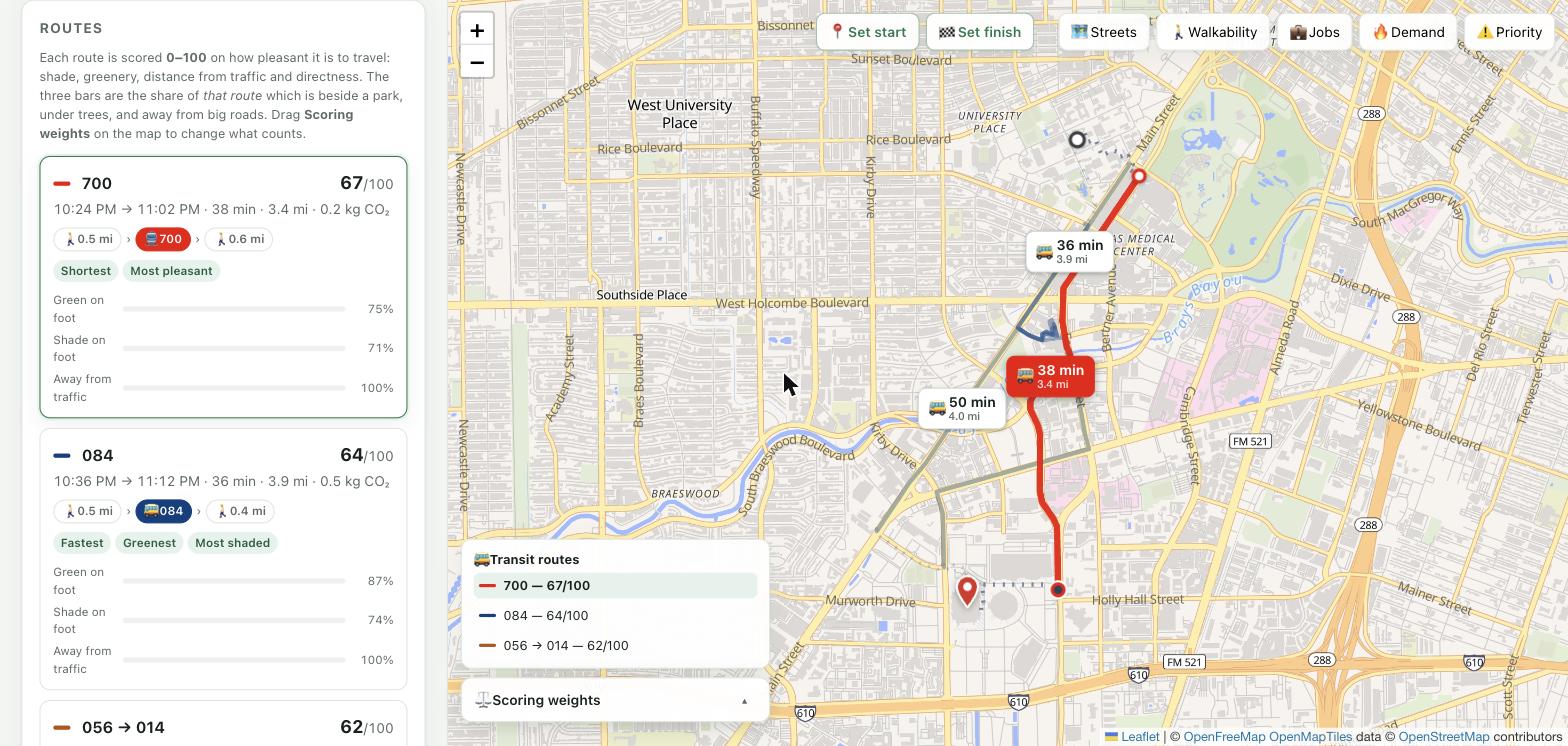
Three real METRO trips on the published timetable — routes 700, 084 and 056→014. Nothing about the network is written into the app
Inspiration
Hosting the FIFA World Cup 2026 brought an unprecedented surge of visitors all across the globe to the host cities, including Houston, converging on a small number of venues and districts and the surrounding downtown core for meetings, incentives, conferences, and exhibitions (MICE) activities. This abrupt population concentration will strain the city’s transportation network, expose walkability gaps, and intensify existing inequities in heat exposure and pedestrian infrastructure quality.
For more sustainable MICE events across the cities, we believe participants’ trips to hosting sites should be safe and pleasant, because getting there is the very first part of the event experience. During peak summer in Houston (late July-early August), average high temperatures reach about 96°F, and the heat index regularly climbs past 105°F, the threshold at which the National Weather Service issues a Heat Advisory and recommends postponing strenuous outdoor activity. Given that many MICE venues in downtown Houston are a 10-20 minute walk apart, even a short walk during peak-heat hours can be hazardous for attendees.
This is why we believe it's crucial to give the general public intuitive information about what a trip between venues will actually feel like, not just the distance, but how shaded the route is, how walkable it is, and what amenities are along the way. Our routing incorporates four core layers: Urban Heat Island (UHI) intensity, tree canopy coverage, an existing walkability index, and sidewalk density, with a businesses layer added for high-intensity urban corridors to surface amenities like shade-adjacent shops or rest points. Knowing this in advance makes it much easier for participants to plan a walking trip with confidence, which in turn reduces reliance on cars for short distances and eases road congestion and parking pressure. In the longer term, we also believe reduced reliance on cars can break a self-reinforcing loop of the urban heat island: air conditioning systems pump the hot air out; this waste heat raises ambient outdoor temperatures, which drives even more demand for air conditioning. Rather than solving the underlying heat problem directly, our project aims to interrupt this heat-driving cycle indirectly, improving the experience for MICE participants and supporting more sustainable, walkable events overall.
Currently, cities lack a data-driven answer to two linked questions asked before MICE events. First, which corridors will actually see heavy visitor movement, and are they walkable, shaded, and served by transit or amenities? Second, where should sustainability investment such as shade infrastructure, sidewalk repair, and shuttle service be prioritized for the greatest impact during mega events? Our project addresses both from one pipeline. A public-facing multimodal route comparison and a corridor classification layer identify where heavy pedestrian movement overlaps with poor walking conditions.
What it does
Houston Route Comparison answers two linked questions for two audiences from a single pipeline.
For visitors and residents, it compares real routes between any two points in Texas across four modes, whether that's walk, bike, METRO, drive, and scores each one on how it will actually feel through criteria such as green space, tree canopy, distance from traffic, directness, the local walkability index, and the live heat index. Alongside the score, it reports $CO_2$ emitted or avoided versus driving solo, calories burned, unshaded minutes outdoors, and the longest stretch without drinking water. Users can control the scoring weights live, so someone who cares more about shade than distance can say so and see the ranking change instantly.
For event planners and city legislatives, the same data answers Track 4's corridor classification question: which corridors carry the heaviest visitor movement, and are they walkable? We simulated 1,000 walking trips from 161 origins (89 hotels plus neighborhood points) to four World Cup venues, counted how often each 60m cell was crossed, and multiplied that demand against a walkability cost surface. Fannin Street through University Place stood out, scoring 63% higher than anywhere else in Houston, carrying 23% of all simulated trips across the worst walking surface of any corridor at that volume. This street should definitely be prioritized if Houston renovates the street.
How we built it
The routing itself runs on real infrastructure, not straight-line estimates. It runs OSRM for walking, cycling, and driving; MOTIS via Transitous, routed over Houston METRO's own published GTFS feed, for rail and bus, so transit results are real scheduled trips with real stop names and departure times, not synthetic estimates. Green space, tree canopy, and drinking fountains come from OpenStreetMap via Overpass. Heat and air quality come from Open-Meteo, with the National Weather Service heat index computed in-app from raw temperature and humidity, using the same Rothfusz regression the NWS uses, so the number could be checked rather than trusted blindly.
The walkability layer itself is a 53MB GeoTIFF we built through ArcGIS Pro from multiple public datasets (LiDAR and LANDSAT canopy, EPA Smart Location data, pedestrian infrastructure classification), weighted according to values benchmarked against two peer-reviewed GIS walkability studies rather than picked arbitrarily. We validated it through known-walkable Houston landmarks (Rice Village, Montrose) and known-unwalkable ones (a tollway interchange, the ship channel) separate cleanly with zero overlap.
For the corridor classification layer, 256,321 Harris County business records were aggregated to a 150m grid for economic intensity, and 1,000 simulated walking trips were routed on OSRM's foot profile to produce demand intensity, which is the two combined into a single priority score.
Challenges we ran into
Our own scoring formula rewarded the wrong routes. Early on, walkability was averaged over the length of a route, which meant a longer detour through Hermann Park could out-score a direct and decent path just because it had slightly more shades and well maintained sidewalk. We had to rebuild the score around burden (quality per unit of actual progress toward the destination) rather than quality alone.
The app was built around heat, with no heat data. For most of development, "unshaded minutes" was pure geometry. It read exactly the same at 70°F as at 105°F. The tool's entire premise wasn't backed by anything until we added live hourly conditions and computed the heat index ourselves.
Transit routes broke the shade metric. Averaging tree canopy over an entire rail ride, miles of window view included, buried the half-mile walk that actually determines whether the trip is bearable. We had to rescore transit trips on their walking legs only.
Accessibility numbers can lie by omission. Our step-free routing profile budgets walking distance differently than the standard profile, which silently dropped valid routes from wheelchair-pace results for reasons that had nothing to do with real barriers, a bug that, left unfixed, would have looked like a faulty finding about Houston's accessibility rather than a unit mismatch in our own defaults.
Accomplishments that we're proud of
- A specific, defensible, single-street recommendation (Fannin Street) instead of a general "improve walkability" dashboard
- A walkability index we validated against ground truth before trusting it, rather than assuming it was correctly oriented
- Real, live-scheduled transit routing, not estimated headways, built directly on METRO's own published data
- Catching and fixing our own methodology errors (burden scoring, the heat data gap, the step-free budget mismatch) before they became false conclusions in the final product
What we learned
We learned a lot from the challenges that we overcame. A walkability score is easy to compute and easy to get backwards, validating polarity against real landmarks caught a bug that would have inverted every recommendation the tool makes while looking perfectly confident. Averages hide the part of a trip that actually matters. A transit ride's average shade is a meaningless number when the walk to the platform is the only part anyone experiences directly.
What's next
- Swap OpenStreetMap's under-mapped tree data (~2,000 individually tagged trees inside the loop) for the City of Houston's canopy raster or Landsat land-surface-temperature tiles
- Extend the same pipeline to the other ten FIFA 2026 U.S. host cities using the same open data sources
- Add continuous canopy-cover and heat rasters to replace the current binary in/out canopy detection
- Turn the priority corridor list into an actual cost/benefit estimate for specific interventions (shade structures, sidewalk repair, shuttle service) so a city can see not just where to invest, but roughly what it would cost
Built With
- css3
- geojson
- geospatial
- geotiff
- gis
- github
- github-actions
- gtfs
- html5
- javascript
- leaflet.js
- maplibre-gl
- motis
- node.js
- nominatim
- numpy
- open-meteo
- openfreemap
- openstreetmap
- osrm
- overpass-api
- photon
- python
- svg
- transitous


Log in or sign up for Devpost to join the conversation.