Devpost
Participate in our public hackathons
Devpost for Teams
Access your company's private hackathons
Grow your developer ecosystem and promote your platform
Drive innovation, collaboration, and retention within your organization
By use case
Blog
Insights into hackathon planning and participation
Customer stories
Inspiration from peers and other industry leaders
Planning guides
Best practices for planning online and in-person hackathons
Webinars & events
Upcoming events and on-demand recordings
Help desk
Common questions and support documentation
Sort by:
Explore a dataset of global cyber attacks from 2015 to 2024.
This project is an interactive AI Insights Dashboard that shows how prepared countries are for AI, how the job market is shifting, and where investments are flowing.
Where Analytics Meet the Human Experience.
This dashboard contains the most updated data related to the economy, finance, business and investment in Indonesia for decision making.
High Cloud Airline Project – Analyzed airline data using Excel, SQL, Power BI, and Tableau. Performed data cleaning, SQL queries, and built interactive Dashboards
The Dashboard for Food Delivery data
The city speaks, we listen.
Our project, Revenue Flow Intelligence, fixes the slow Quote-to-Cash process. Using Tableau Next, AI, & proactive Slack alerts, it finds bottlenecks and drives immediate action to accelerate revenue.
Project that utilizes Tableau Next on the Air Travel data to create the advance booking savings and Policy Compliance.
Unfilled vacancies are costly, impact current staff and product quality negatively. We demonstrate how Tabeau Next Dashboards and Agents accelerate recruiting speed and improve recruiting decisions.
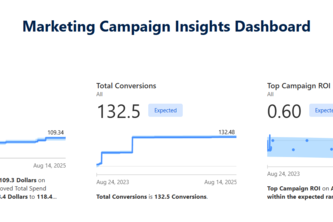
Track marketing campaign performance.
An interactive Tableau dashboard uncovering funding
“Automated, interpretable data preprocessing for smarter, cleaner machine learning.”
Marketing sparks it. Sales seals it. Tableau Next tracks it.
Pulse Telecom ConciergeIQ is an agentic Tableau Next dashboard with Slack integration, built for managers to make confident, data-driven decisions. “Talk to Your Data. Act with Confidence.”
Turning invisible work into measurable impact.
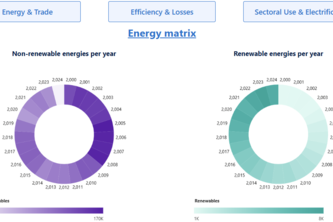
Tableau dashboard on Ireland’s energy system: energy mix, efficiency, consumption, and trade. Insights for innovation, sustainability, and a greener future.
xpand into mental health and environmental safety, launch a mobile app for SMEs, and partner with NGOs to scale globally, ensuring free training for workers everywhere.
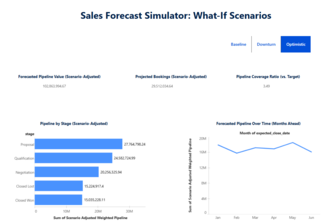
An interactive Weighted Pipeline Simulator that lets sales leaders run what-if analyses on their CRM pipeline, showcasing how agentic analytics can transform forecasting and decision-making.
RevBoost is a Revenue Intelligence Dashboard built using Tableau Next + Salesforce, focused on identifying churn risks and revenue acceleration opportunities using agentic analytics.
Churn prediction + Trend Forecasting + Slack Alerts
We track what we sell, but what we buy matters equally. EcoChain treats vendors as accounts, using Tableau Next to track spend-based CO₂, flag risks, and trigger actions for sustainability management.
"Sustainable Supply Chain Analyzer" will provide real-time insights into supply chain operations, help businesses identify areas for improvement.
Using Tableau Next For Small Business Integrations