-
-
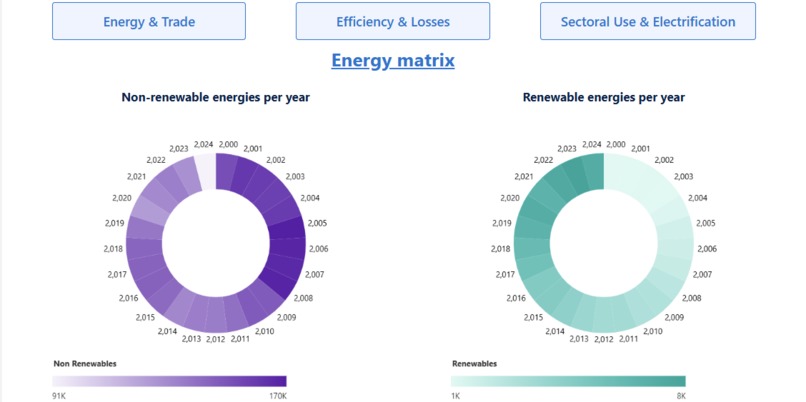
Irish Energy Matrix per year

About the project
Inspiration
Ireland’s energy transition is one of Europe’s most ambitious. I was inspired by the challenge of visualizing how the country balances fossil fuels and renewables, while also identifying opportunities for efficiency, innovation, and sustainability.
What it does
The project is an interactive Tableau dashboard that analyzes Ireland’s energy system over the last 20 years. It covers four main areas:
- Energy Mix: evolution of fossil fuels vs. renewables.
- Efficiency & Losses: where energy is wasted across the system.
- Consumption by Sector: transport, residential, and industry.
- Energy Trade: Ireland’s dependence on imports.
How we built it
- Gathered historical energy data (renewables, non-renewables, imports/exports, consumption).
- Cleaned and structured the data for consistency.
- Built interactive dashboards in Tableau with filters and trend visualizations.
- Focused on clarity and storytelling to highlight Ireland’s progress and challenges.
Challenges we ran into
- Finding consistent and reliable datasets across years.
- Balancing technical detail with a clear visual narrative.
- Designing dashboards that are both informative and intuitive for non-experts.
Accomplishments that we're proud of
- Built a clear, interactive tool that helps identify opportunities for energy efficiency and sustainability.
- Highlighted Ireland’s progress in reducing dependency on fossil fuels and improving efficiency.
- Created a resource that can support decision-making for policymakers, companies, and communities.
What we learned
- How to translate complex energy data into accessible visual insights.
- The importance of efficiency and losses in shaping a sustainable energy system.
- Advanced Tableau techniques for storytelling and data visualization.
What's next for Ireland’s Energy Mix: Sources, Challenges & Future Outlook
- Expand the dashboard with real-time data feeds.
- Integrate predictive models for Ireland’s 2030 and 2050 carbon-neutral targets.
- Compare Ireland’s progress with other EU countries.
- Explore advanced analytics with Python, SQL, and AI/ML models to forecast trends.

Log in or sign up for Devpost to join the conversation.