-
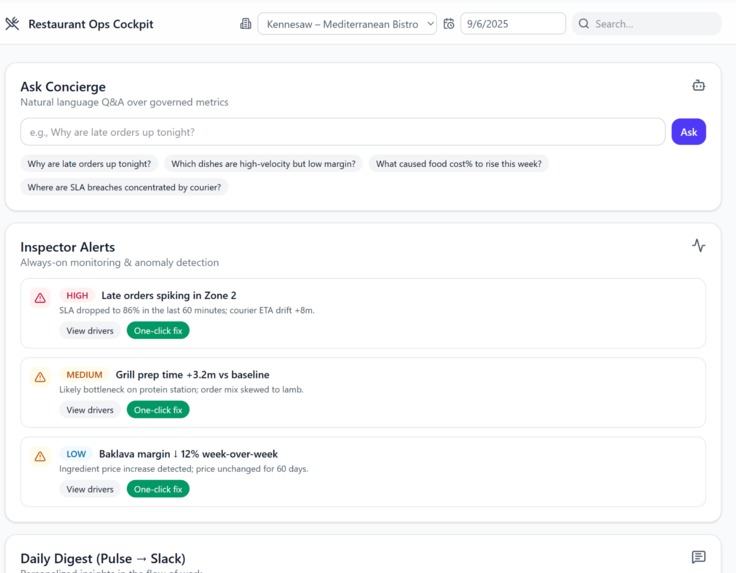
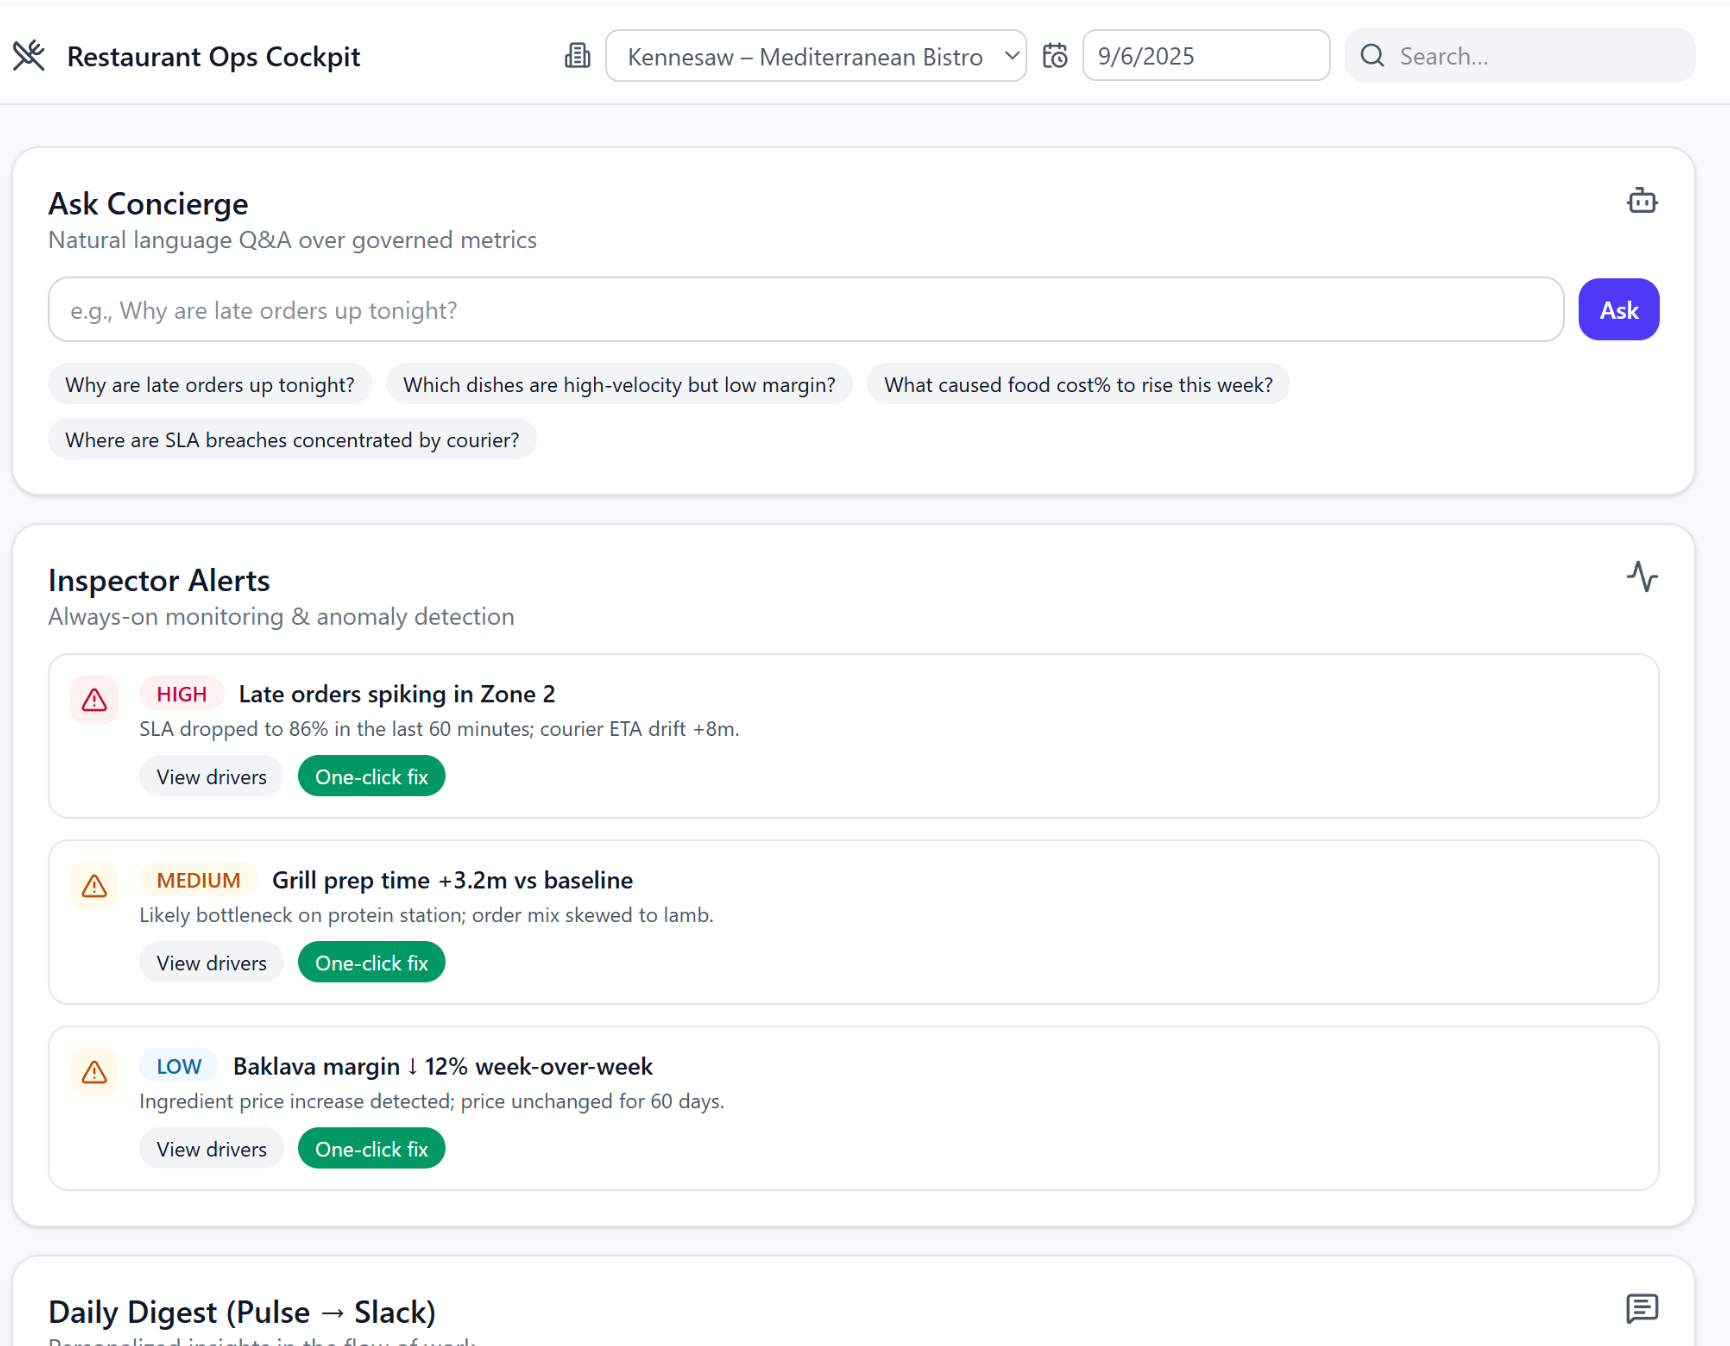
Restaurant Cockpit Mockup
Project Overview
I built an agentic Restaurant Operations Cockpit in Tableau Next to help managers catch issues during the shift, not the next day. The idea came from repeatedly seeing late deliveries, food-cost creep, and grill bottlenecks surface after the fact. I wanted a single surface where anyone could ask a question, trust the answer, and take action immediately.
I ingested eight sources into Salesforce Data Cloud, added conformed Date and Location dimensions, and modeled everything in the Semantic Layer so metrics are certified and reusable. With that governed model, I created a Z-pattern dashboard with KPI tiles (Sales, Food Cost %, Labor %, SLA %, ETA drift), a Sales trend, Delivery (SLA by zone), Kitchen (ETA-drift proxy), Menu Engineering (velocity vs margin), Labor, and Feedback.
I learned that high-quality semantics are the foundation of trustworthy AI and cross-fact ratios; aligning everything on Date × Location was key. The biggest challenges were editor syntax and cross-entity math, which I solved with derived metrics and simple, portable expressions. The result is a cockpit that turns analytics into outcomes: see a spike, understand why, and fix it on the spot.
Next Steps
The next steps for the hackathon (that I was not able to complete in time to submit this entry) was to enable Concierge for natural-language Q&A (“Why are late orders up tonight?”) and set up Inspector to watch for Zone-2 SLA dips and ingredient price spikes. Finally, I was going to enable Salesforce Flow actions into the visuals—adding a driver, shrinking a delivery zone, reordering ingredients, or proposing a price tweak—and used Pulse to send personalized daily digests to Slack. Even though I was not able to submit the full finished idea in time for the Hackathon, I will reiterate on this idea and try again in a hackathon in the future.