-
-
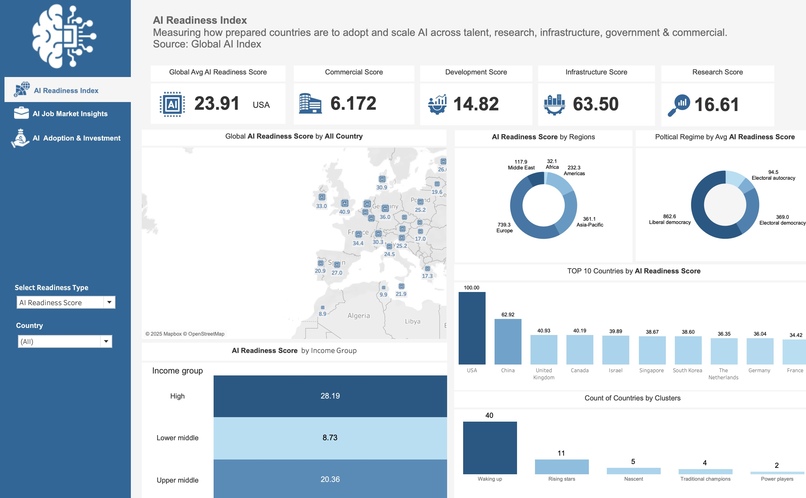
Explore global AI readiness by country, region, income, and regime with KPIs, maps, and filters for talent, research, infra & more.
-
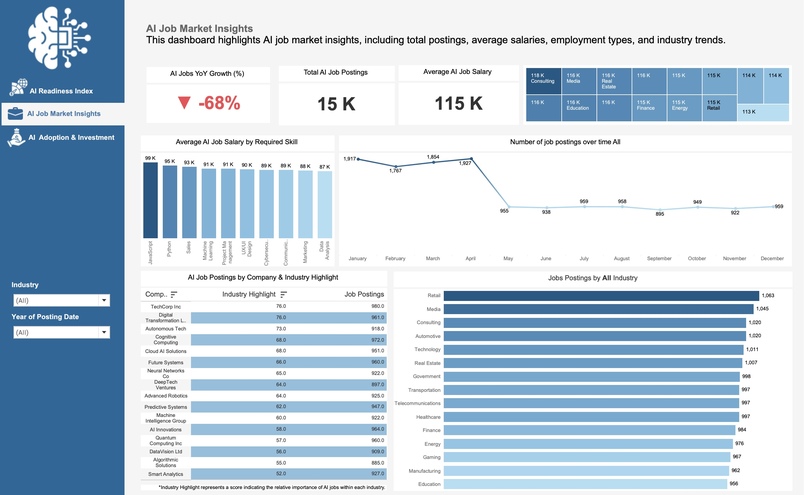
AI job KPIs: growth, postings & salaries. Interactive treemap, skills analysis, trends & industries reveal workforce opportunities.
-
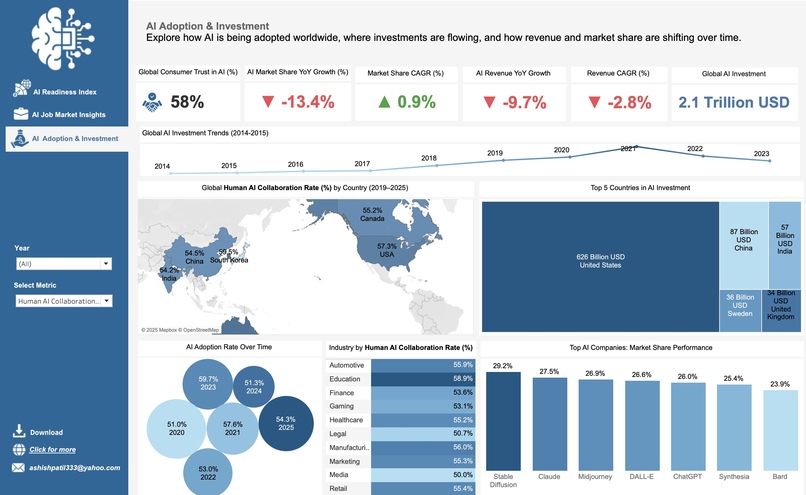
rack AI trust, YoY & CAGR of market share & revenue, $2.1T investments, adoption trends & company dominance worldwide.


✨ Inspiration
Artificial Intelligence (AI) is transforming nations, industries, and jobs worldwide, but the data is often fragmented and siloed.
- Some countries are well-prepared, others lag.
- Jobs are growing but with uncertain stability.
- Investments are massive, yet adoption is imbalanced.
This inspired me to create the AI Insights Dashboard, an interactive project in Tableau that brings all perspectives together.
💡 What it does
The AI Insights Dashboard provides three interactive modules:
- 🌍 AI Readiness Index — compares countries by readiness, income groups, political regimes, and regions.
- 💼 AI Job Market Insights — explores job postings, salaries, skills demand, and industry impact.
- 💰 AI Investment & Adoption — analyzes global investment flows, consumer trust, market share, revenues, and human–AI collaboration vs. job loss.
Users can explore KPIs, maps, treemaps, and line charts with filters and parameters that make the dashboard fully interactive.
🛠️ How we built it
- Cleaned and transformed datasets (readiness, jobs, investments) in Excel.
- Designed and built the dashboard in Tableau, using:
- Parameters for readiness types, collaboration vs. job loss.
- Calculated fields for YoY growth and CAGR.
- KPIs and charts: maps, treemaps, highlight tables, and time-series.
- Parameters for readiness types, collaboration vs. job loss.
- Designed the presentation flow in Canva.
- Recorded the demo using OBS Studio with screen + camera.
🚧 Challenges we ran into
- Handling null values in Human–AI Collaboration data.
- Correctly calculating YoY growth and CAGR in Tableau.
- Formatting large investment numbers into billions/trillions cleanly.
- Designing a professional layout with clear navigation and consistent visuals.
- Recording with OBS and setting up a teleprompter-style script without showing it on screen.
🏆 Accomplishments that we're proud of
- Built three full dashboards with 20+ KPIs and visualizations.
- Made the dashboards fully interactive with parameters and filters.
- Created a polished video presentation with both face intro and dashboard walkthrough.
- Gained deep insights into AI’s real-world impact across countries, jobs, and investments.
🎓 What we learned
- Advanced Tableau techniques: parameterized KPIs, calculated YoY & CAGR, highlight tables, dashboard containers.
- Storytelling with data: structuring insights into three themes.
- Presentation skills: scripting, teleprompter setup, and smooth recording.
- Analytical insight: AI companies are capturing market share but not consistent revenue growth, while AI jobs remain high-paying but unevenly distributed.
🚀 What's next for AI Insights Dashboard
- Expand datasets with real-time AI funding and job postings APIs.
- Add predictive modeling for future readiness scores and AI adoption.
- Improve design with custom visuals and better mobile responsiveness.
- Share the dashboard as a public Tableau story so policymakers, researchers, and businesses can explore AI’s impact interactively.


Log in or sign up for Devpost to join the conversation.