Devpost
Participate in our public hackathons
Devpost for Teams
Access your company's private hackathons
Grow your developer ecosystem and promote your platform
Drive innovation, collaboration, and retention within your organization
By use case
Blog
Insights into hackathon planning and participation
Customer stories
Inspiration from peers and other industry leaders
Planning guides
Best practices for planning online and in-person hackathons
Webinars & events
Upcoming events and on-demand recordings
Help desk
Common questions and support documentation
Sort by:
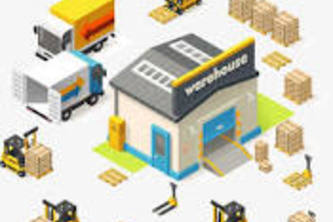
Transforms warehouse layouts into an interactive dashboard, empowering managers to redesign stock placement, cut picker travel time, and optimize both labor and inventory capacity.
a
Slack is the place to be. (Tableau) Next Question removes barriers to get to your data in that context. Insights from Tableau Next and Tableau Core come to Slack and to each other, seamlessly.
Next Level Tableau Nexting
Veritas: Your brand's autonomous digital defense.
GridWise helps utilities balance AI demand with renewables and storage, turning grid data into real-time actions.
SkyLuxe aggregates empty leg flights across private jet operators, unlocking real-time access to premium aviation at non-premium pricing. The platform addresses a $40B annual opportunity.
Dashboard integrates CRMA with Tableau Next to give sales leaders real-time insights on accounts, enabling strategic ABX planning, resource allocation, and engagement optimization
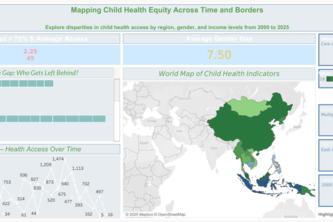
Visualizing child health equity across borders and time.
From data to foresight: Shaping the future of patient journeys.
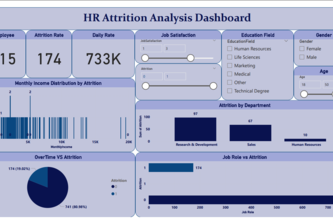
Used machine learning and Tableau to uncover key drivers of employee attrition, enabling data-driven HR strategies to boost retention and employee satisfaction.
Powering retail teams with live, actionable intelligence which helps business leaders to react in the moment and make decisions that directly enhance revenue, efficiency, and customer satisfaction.
The AI-driven platform that moves your utility from reacting to customer issues to proactively finding new revenue streams and automating risk management
Read the data like a book and feel it
Google Business Intelligence Certificate: Cyclistic Scenario
Google Business Intelligence Certificate: Google Fiber Scenario
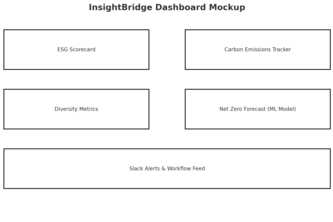
InsightBridge empowers enterprises to track, analyze, and act on their ESG (Environmental, Social, and Governance) performance using real-time data visualizations, AI-driven recommendations
The Personal Weather Station Dashboard is visually engaging, insightful, and gives you room to showcase data storytelling, interactivity, and design.
Empower your sales team with Sales Wizard, to get live Tableau NEXT insights, generate quotes, update records, and raise cases — all without switching tools. Less juggling, MORE SELLING!
Taxes can be a pain and stressful for influencers. I created a tool that makes tax season easier for them. They can quickly gather actionable insights on income and tax liability.
Our Churn Prevention dashboard powered by Tableau Next predicts Churn before it happens, identifying high-risk clients and triggering automated retention workflows to keep them engaged.
This project visualizes key sales metrics, helping businesses analyze sales performance across different regions, products, and timeframes.
I made dashboard using different features versus other features. I used box plot, bar plot, pie chart etc.
Sanjeevani.ai an AI-powered platform designed to revolutionize blood donation and care for Thalassemia patients in India, bridges patients with donors in real time, forecasts availability through AI.