-
-
Dashboard
-
Data
-
Flow Builder
-
Semantic Model
-
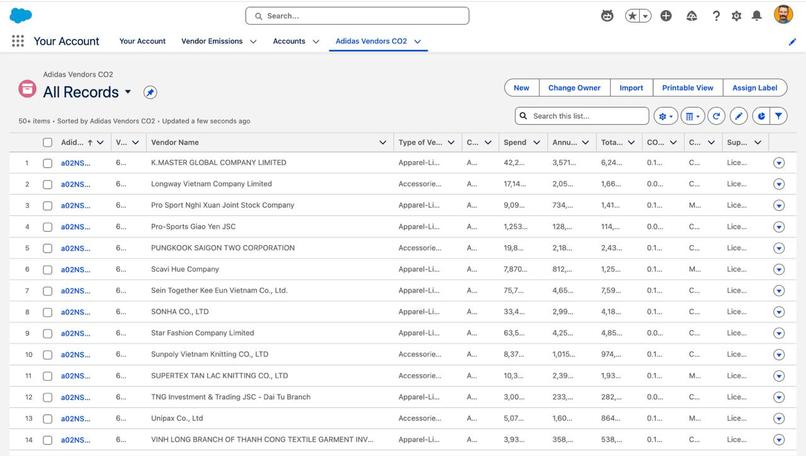
Vendor Records

Inspiration
Salesforce is the world’s #1 CRM, efficiently built for managing customers and sales. This made us ask: what about what companies buy? Since its structure works so well for customer accounts, couldn’t it be equally effective for vendor accounts? After all, the roles are simply reversed. Vendors drive cost, risk, product quality, and sustainability. Scope 3 emissions (supplier emissions) account for more than 70% of most companies’ carbon footprint, yet they’re often hidden away in spreadsheets. As the world rapidly moves forward, our duty to the planet and our passion for sustainability must move forward too. We also wanted to master these platforms inside and out, and what better way to do that than by creating a completely new use case that lets us explore deeply, customize freely, and fully experiment with the tools at hand. With this intent, we set out to flip Salesforce + Tableau Next: to treat vendors as Accounts, track their CO₂, and in turn the company's itself and connect insights directly to actions.
What It does
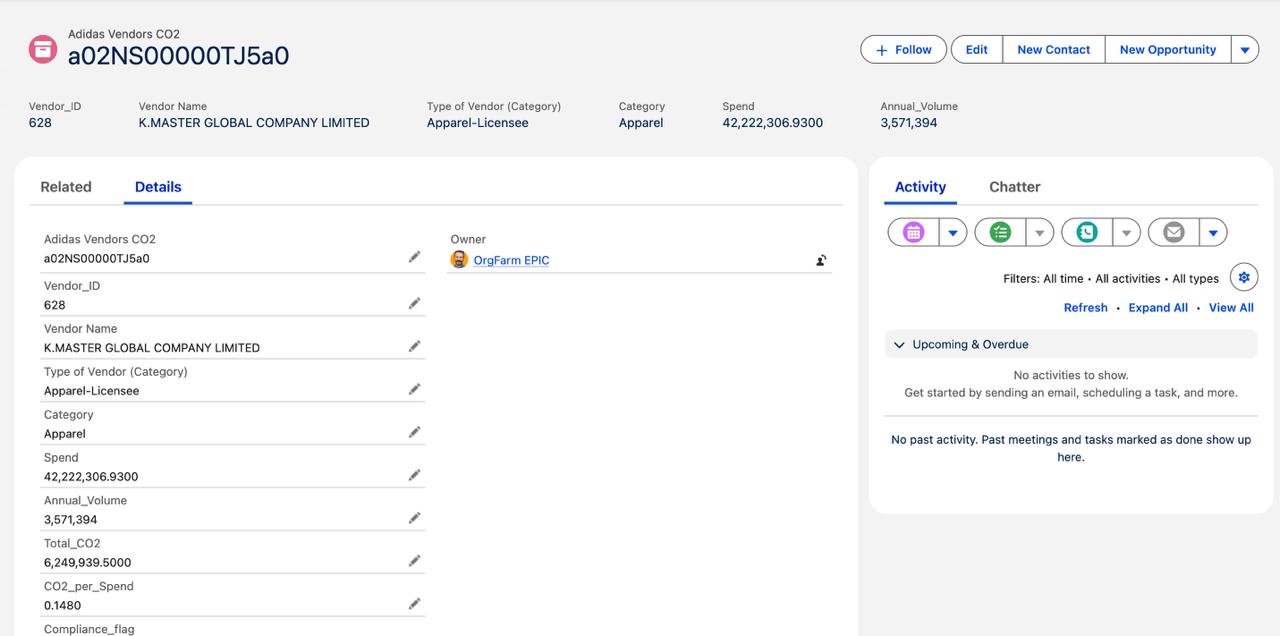
We built our solution as a prototype vendor sustainability solution for Adidas, inspired by their publicly disclosed global supplier list. Adidas, like many fashion brands, faces intense pressure to address Scope 3 emissions across its complex supply chain. We imported Adidas’ supplier names, locations, and other details into Salesforce, then fabricated realistic sustainability fields like spend, CO₂ intensity, compliance flags, etc. to model how a brand like them could track and act on vendor emissions in real time. EcoChain gives businesses a 360° view of vendors.
Track
- Vendor spend
- CO₂ intensity
- Compliance
- Contacts in Salesforce
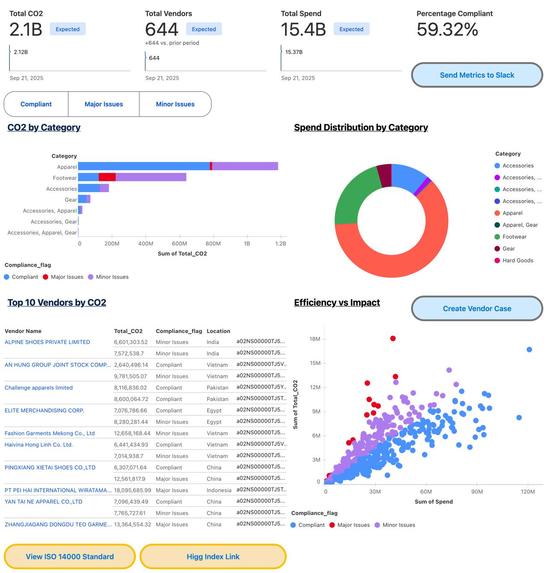
Visualize (KPIs + dashboards in Tableau Next)
- Total Spend
- Total CO₂
- % Compliant Vendors
- CO₂ per $ Spent
Analyze
- High-risk vendors (scatterplots)
- CO₂ by different categories (e.g., footwear, apparel) (bar charts)
- Top emitters
- Spend distribution across categories (donut charts)
Act
- Open vendor records directly from Tableau
- Auto-create high-priority remediation cases for non-compliant vendors
- Push daily ESG digests into Slack From data → insights → action.
Who It Helps
- Category Managers (Footwear, Apparel, Accessories): Analyze vendors to redesign materials and products.
- Procurement Managers: Compare spend vs CO₂ and renegotiate contracts.
- Sustainability Managers: Monitor compliance and ESG progress.
- Executives: Oversee vendor portfolio risk and impact.
- Marketing Teams: Turn metrics into transparent ESG reports for customers and regulators.
How We Built It
Data
- Sheet 1: CSV file containing Vendor emissions (Vendor Name, Spend, CO₂ per $, Category, Annual Volume, CO₂ per Unit, Compliance Flag).
- Vendor names from Adidas
- Remaining data fabricated using realistic assumptions
- Sheet 2: Vendor contacts (addresses, phone, email). Taken from Adidas’s public supplier list.
Vendor Data Generation CO2 per unit: Randomized within realistic industry limits for each vendor category Annual volume: Randomized based on vendor size Spend calculation: Used random multiplication factor applied to annual volume to keep it proportional Total CO2 Calculation Formula: \ The CO₂ per spend thresholds are defined as follows: values below 0.15 kg CO₂ per USD are considered compliant, values between 0.15 and 0.30 kg CO₂ per USD indicate minor issues, and values above 0.30 kg CO₂ per USD represent major issues.
The formula is \( Total CO2 = CO2_(perunit) \times Volume_(annual) \).
Salesforce
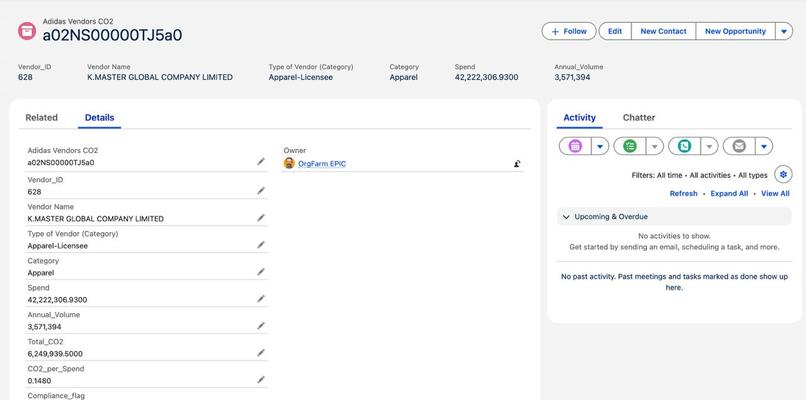
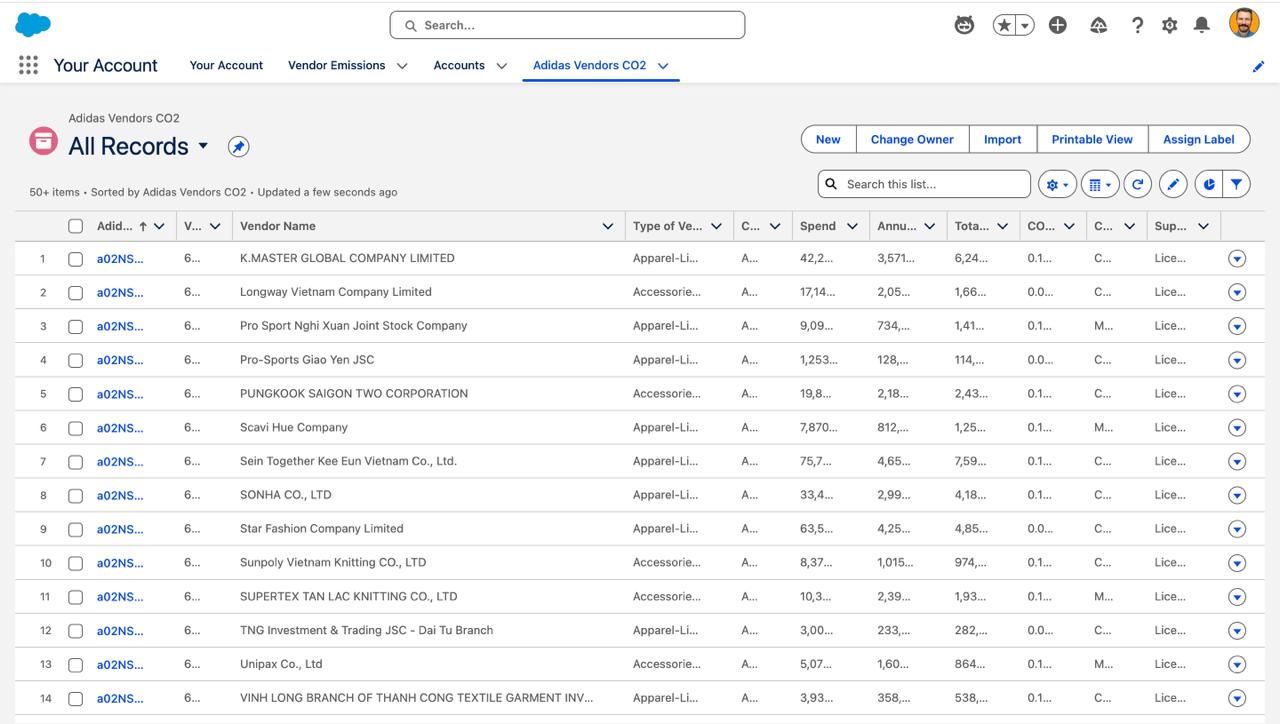
- Created a custom object: Adidas Vendors CO2
- Uploaded emissions from Sheet 1
- Configured permissions, list views, and filters
- Created a data stream on Data Cloud and activated it
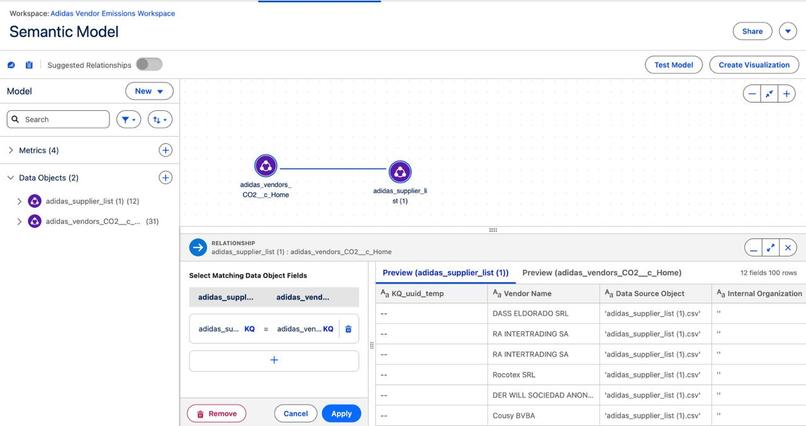
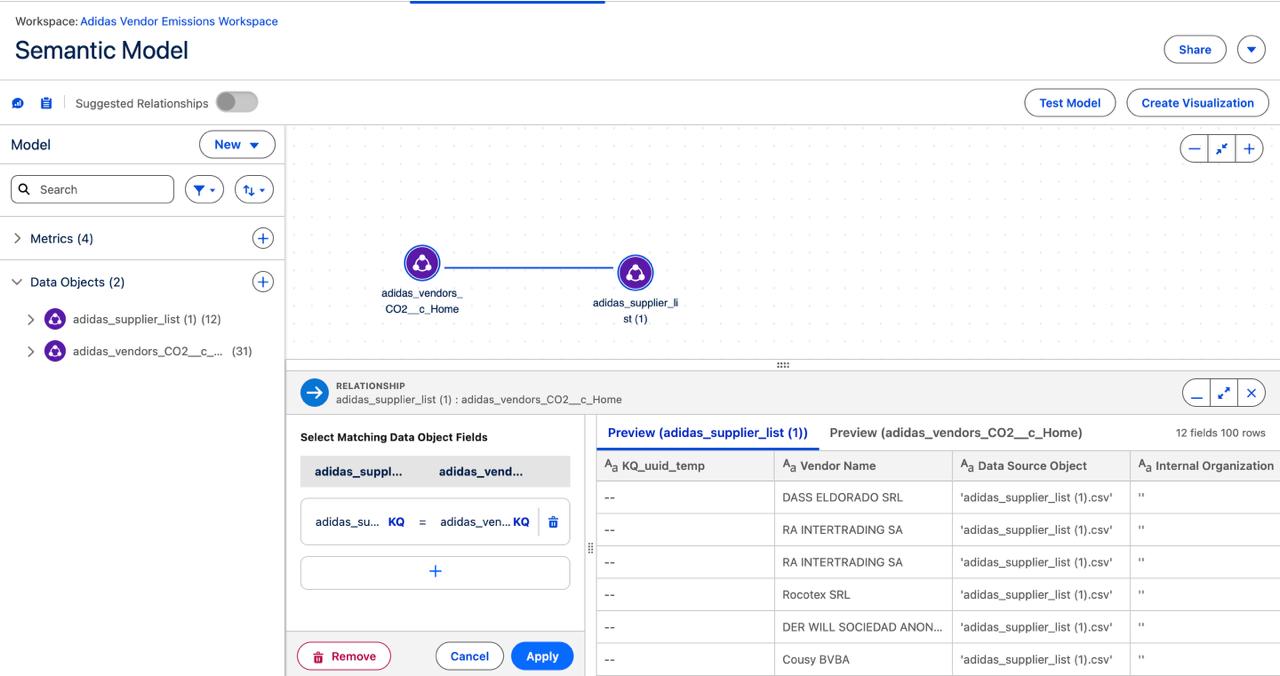
Tableau Next
- Created a workspace for the project
- Built a semantic model of Sheet 1 and uploaded Sheet 2 to link via Vendor IDs
- Added calculated fields for CO₂ tracking
- Designed visualizations and metrics using Marks, Analytics, and other Tableau Next features
- Assembled these into a new dashboard to showcase all findings efficiently
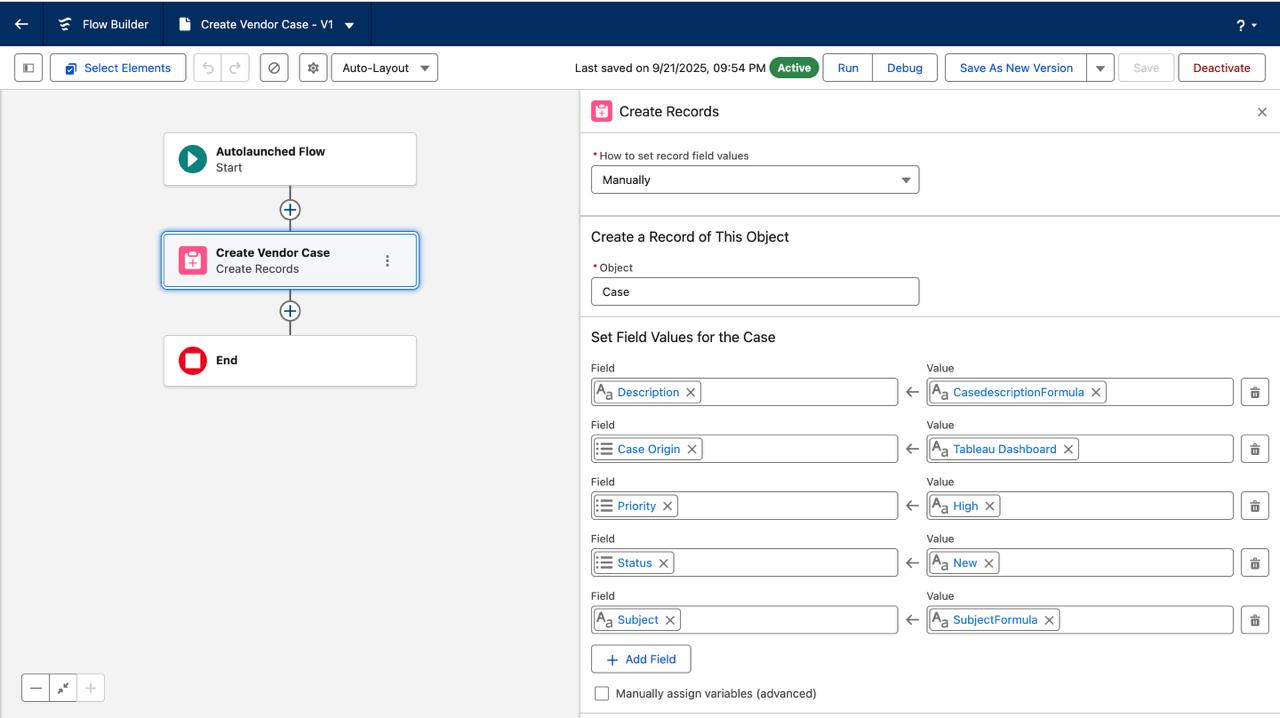
Flows & Actions
- Added the Open Vendor Record action on a visualization from the available list of actions
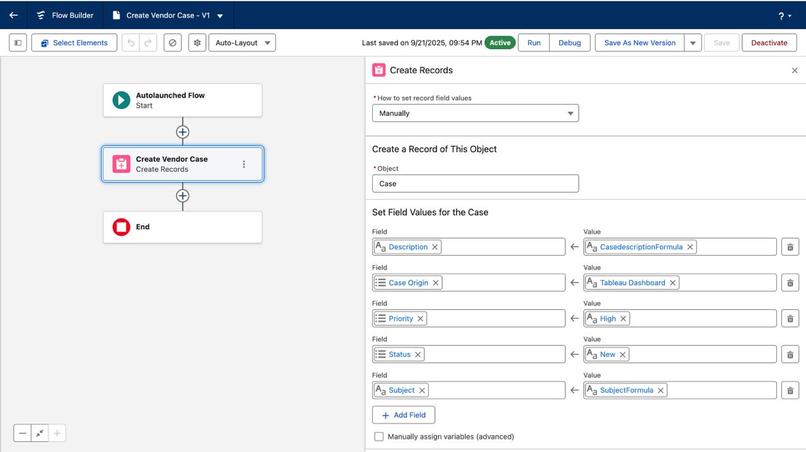
- Built a Custom Flow → “Create Vendor Case”
- Auto-populates vendor details + compliance status
- Marks case as High Priority
- Creates a case in Salesforce
- Used Salesforce → Slack integration to send an ESG Pulse Digest to a Slack channel
- Achieved by exploring Salesforce’s Guided Slack Setup
Challenges We Ran Into
- Vendor data availability: Adidas publishes its supplier list, but vendors don’t disclose key fields like spend, CO₂ intensity, or compliance. We had to fabricate these fields carefully to stay realistic while enabling meaningful ESG analysis.
- Category comparability: Units differed across suppliers (pairs of shoes, meters of fabric, pieces of accessories). We solved this by normalizing on CO₂ per $ spent, which allowed cross-category analysis.
- Salesforce object linking: Ensuring vendor emissions records mapped cleanly to Accounts without duplicating data was tricky.
- Tableau Next limitations: Missing features (trend lines, size marks, formatting) forced us to find creative workarounds.
- Time pressure: Building end-to-end custom objects, metrics, dashboards, and flows as we discovered them within the hackathon window was intense but rewarding.
Accomplishments That We’re Proud Of
- Repurposed Salesforce beyond sales: Transformed it into a platform for ESG vendor management.
- Built end-to-end integration: From custom objects → semantic model → KPIs → dashboards → flows → Slack alerts, ensuring everything stayed connected with minimal breaks.
- Made analytics actionable: Not just visualizations, but real workflows — creating cases, triggering alerts, and opening vendor records directly from dashboards.
- Adapted quickly to new tools: Mastered Salesforce objects, Tableau Next’s semantic model, and custom flows within a short hackathon window.
Aligned with UN Sustainable Development Goals (SDGs):
- SDG 12 – Responsible Consumption & Production: Embedding sustainability into procurement.
- SDG 13 – Climate Action: Making vendor emissions visible and actionable.
- SDG 17 – Partnerships for the Goals: Treating vendors as partners in decarbonization.
What We Learned
- How to create custom objects, define relationships, manage imports, build flows and create data streams
- Separating metrics from visualizations gave us reusable KPIs and a cleaner semantic model.
- Grounding our dataset in Adidas’ supplier list and fabricating spend/CO₂ fields showed us the balance between credibility and creativity in hackathons.
- Normalization is key - Comparing vendors by CO₂ per unit across categories was unfair; shifting to CO₂ per $ spent gave us a cross-category lens for meaningful analysis.
- Dashboards alone don’t change outcomes; linking to Slack digests, vendor records, and Salesforce cases turned analytics into workflows.
- Adapting to Salesforce, Tableau Next, and Slack integrations (tools we had little prior experience with) stretched us, but gave us a holistic skill set in a short time.
- How ESG metrics can be embedded into day-to-day procurement, aligning with SDGs while driving business accountability.
What’s Next for EcoChain: The Vendor Sustainability Hub
- Expand beyond fabricated data: Connect to real vendor ESG datasets.
- Add predictive analytics (forecasting vendor CO₂ trends).
- Extend flows into procurement approval processes, involving Managers to receive tasks to consider reallocation or reviews of material bought, exploring vendors as opportunities, connecting multiple dashboards of category and supplier type levels, navigating to URLs containing important documentation of vendor or ESG Certifications.
- Build executive dashboards for reporting against UN SDGs and compliance regulations.
- Scale to become a plug-and-play Salesforce ESG app for enterprises.


Log in or sign up for Devpost to join the conversation.