Devpost
Participate in our public hackathons
Devpost for Teams
Access your company's private hackathons
Grow your developer ecosystem and promote your platform
Drive innovation, collaboration, and retention within your organization
By use case
Blog
Insights into hackathon planning and participation
Customer stories
Inspiration from peers and other industry leaders
Planning guides
Best practices for planning online and in-person hackathons
Webinars & events
Upcoming events and on-demand recordings
Help desk
Common questions and support documentation
Sort by:
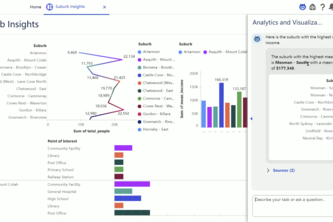
This project aims to provide new immigrants with insights on various suburbs in NSW based on mean income, population count, and number of points of interests e.g. libraries, schools etc.
A business focusing on improving public health through community programs and policy changes could use Tableau Next to analyze the adverse health effects of too much screen time for children.
A condensed report on food waste and ways to curb it.
Faster support! Smarter decisions! Stronger e-commerce! "Flipzon Agentforce combines AI-driven automation with Tableau real-time analytics to turn peak-season chaos into clarity and resilience."
Tracking trends in open and close prices for the biggest companies on the market.
Interactive dashboard unifying NYC data on absenteeism, crime, poverty, housing, and water to spotlight community risks and guide equitable action
Our first tableau project
Our solution helps a private municipality manager in South Africa use Tableau Next to gain insights around the impacts of water and sanitation on the communities they serve.
“See real vs reported college costs, simply.”
Aura is a proactive wellness agent that redefines People Analytics, identifying burnout risks from operational data and empowering managers with predictive insights and simulated interventions.
This interactive Tableau dashboard provides a comprehensive analysis of Electric Vehicle (EV) registration data in the United States.
An AI-powered command center to predict churn and detect high-risk customers, visualize risks protect revenue, and automate retention workflows actions through Tableau, Salesforce Flow, and Slack.
We turn scattered Slack, forum, and support noise into ranked, explainable feature priorities. NLP clusters feedback, scores by frequency, recency & VIP impact, & surfaces it in Salesforce + Tableau.
I built an interactive Tableau dashboard to visualize and analyze global happiness scores and freedom perceptions across regions for the years 2019–2020
Data-driven paths to Divvy loyalty: Converting casual riders to annual members
Go Hard On Protection
Our Slack app enriches messages with data from Tableau Next, giving everyone context to act faster, make smarter decisions, and become a fact-driven communicator.
This project serves to process data and perform exploratory data analysis, extract key business insights. Data driven diagnosis of root causes and offer strategic objectives with a dashboard for KPIs
Use mapping to make visible a hidden financial divide in one of the wealthiest cities in the world.
Kalaa delivers complete and personalized interior solutions, from design to delivery. Unlike traditional retailers, we stand out by providing end-to-end services and customisation using Ai.
An environmentally conscious alternative to regularly used AI models, Green AI is a solution to improving energy and water usage in AI models to optimize and clean up prompts and results.
"Speak Up: Visualizing Character Dialogues in Dungeons & Dragons – A Creative Gantt-Style Exploration of Role-Playing Conversations"
Where Data Meets Dragons — Visualizing the Voice of Heroes
Predicting and understanding crime trends to empower data-driven decision-making for safer, more secure communities