-
-
Marketing Campaign Insights
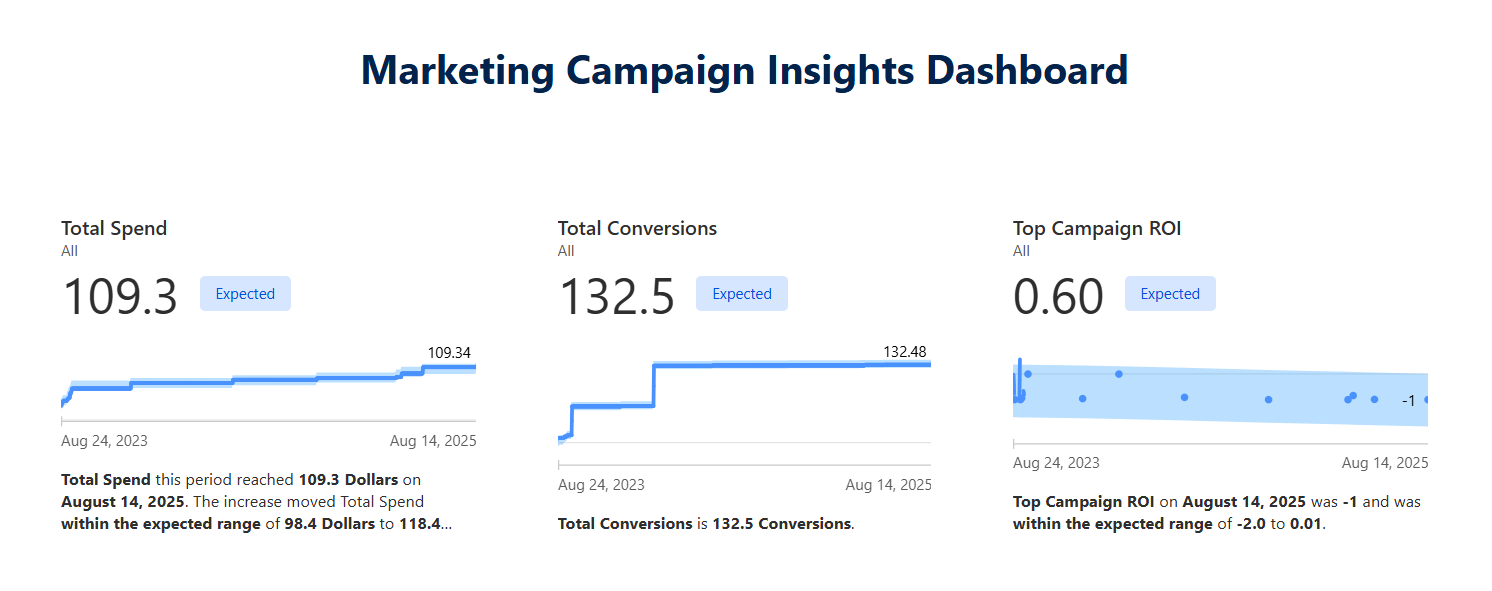
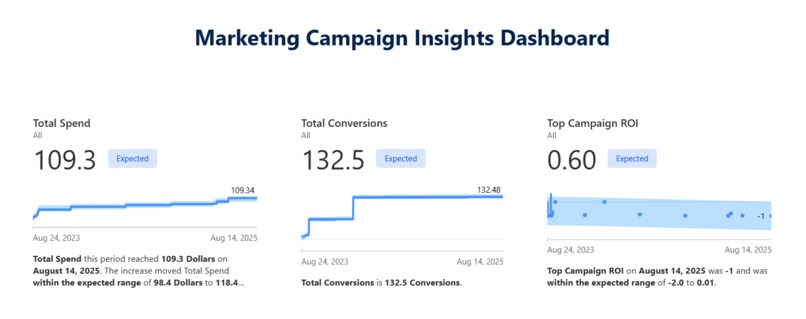
Marketing Campaign Insights Dashboard
Inspiration
We wanted to create a tool that makes marketing analytics more accessible. Many marketing teams struggle with scattered data, unclear ROI, and difficulty in making quick, data-driven decisions. Our goal was to use Tableau Next with Agentforce to simplify insights, enabling non-technical users to ask natural language questions and instantly get visual answers.
What we built
We built a Marketing Campaign Insights Dashboard powered by Salesforce data and Tableau Next.
The dashboard includes:
- Metrics: Total Spend, Total Conversions, and Top Campaign ROI.
- Visualizations: CTR by Campaign (Bar Chart), Spend Distribution by Channel (Donut Chart), and Conversions Over Time (Line Chart).
- Agentforce Testing Concierge: To test natural language queries such as “Which campaign had the highest CTR?” or “Show ROI trends over time.”
How we built it
- Connected data objects from Marketing Trailverse Data and Email Marketing Campaigns.
- Defined primary keys and created calculated fields for CTR, Conversion Rate, and ROI.
- Designed metrics with proper aggregation and formatting (e.g., \$ Spend, % ROI, integer Conversions).
- Built visualizations in Tableau Next and aligned them into a clean dashboard layout.
- Tested Agentforce by asking natural questions to ensure our calculated fields and relationships worked correctly.
Challenges we ran into
- Choosing the right primary keys and ensuring data relationships were correct.
- Formatting metrics (e.g., handling \$ prefixes, percentages, and cumulative sums).
- Making sure the insights generated by Agentforce matched the business meaning (e.g., avoiding CTR > 100% or ROI miscalculations).
- Balancing clarity for non-technical users with detail for analysts.
Accomplishments that we’re proud of
- Successfully built a single dashboard that combines spend, conversions, and ROI into an easy-to-read story.
- Created a consistent metrics formatting standard (\$, %, whole numbers) for clear communication.
- Enabled natural language queries with Agentforce to make analytics accessible to business stakeholders.
What we learned
- How to use Tableau Next’s new metric builder and cumulative aggregations.
- Best practices in designing calculated fields that align with real business KPIs.
- The importance of clean data modeling when using AI-powered assistants.
- How natural language interaction (Agentforce) complements visual dashboards.
What’s next
- Extend the dashboard to include revenue impact and multi-channel attribution.
- Fine-tune natural language queries for more complex business questions.
- Explore real-time campaign monitoring with automated alerts powered by Agentforce.


Log in or sign up for Devpost to join the conversation.