-
-
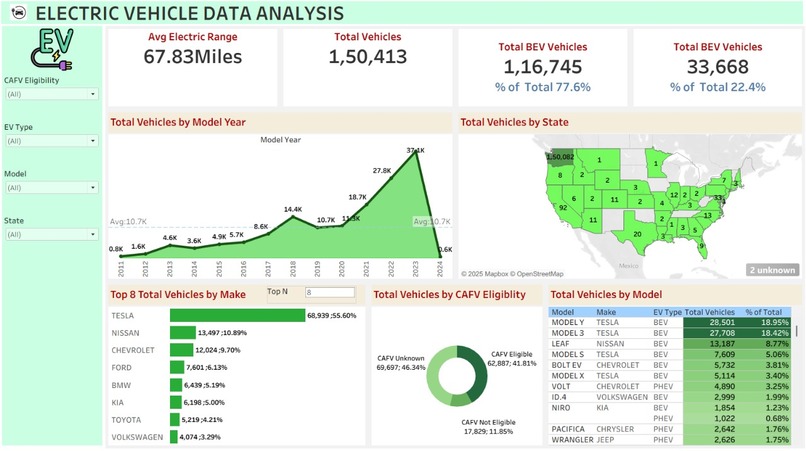
Electric vehicle Data analysis

As a data analytics enthusiast, I’ve always been intrigued by how data can drive sustainable decisions. The growing adoption of Electric Vehicles (EVs) globally sparked my interest in exploring their trends across the United States.
This dashboard was inspired by:
Environmental impact: Understanding how EV adoption supports cleaner transportation.
Data storytelling: I wanted to turn raw data into an interactive, visual story that clearly shows trends, gaps, and opportunities in EV registration.
Skill development: It was also a hands-on opportunity to strengthen my Tableau skills by working with real-world datasets and applying best practices in data visualization.
By creating this project, I aimed to make the EV data more accessible and insightful for stakeholders, policymakers, or anyone interested in the electric mobility space.

Log in or sign up for Devpost to join the conversation.