Devpost
Participate in our public hackathons
Devpost for Teams
Access your company's private hackathons
Grow your developer ecosystem and promote your platform
Drive innovation, collaboration, and retention within your organization
By use case
Blog
Insights into hackathon planning and participation
Customer stories
Inspiration from peers and other industry leaders
Planning guides
Best practices for planning online and in-person hackathons
Webinars & events
Upcoming events and on-demand recordings
Help desk
Common questions and support documentation
Sort by:
Revolutionizing the Public Health Industry through Data Science.
One Texas Team. Infinite Visualization Solutions.
Data visuals for challenge 2 and Social Justice.
Visualizations that helps you make the smart move 🏍️
Two interactive dashboards showing global vaccination progress and COVID-19’s second-order impact on underreported communities, for achieving herd immunity and international health policymaking.
With the adverse effects of COVID-19 still lingering in several countries, analyzing public health has never been more crucial.
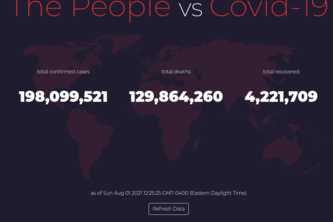
Interact with visualizations that document the history and current state of the Covid-19. Learn how you can "flatten the curve" to fight this pandemic.
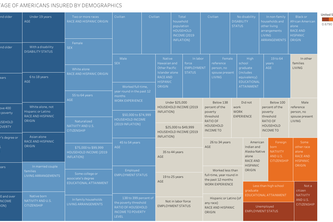
A look into who was unable to work because of the pandemic
⭐⭐Corona Virus Dataset Visualisation⭐⭐
Data visualization using bar graphs
Want to know the rise or fall in COVID-19 cases? Well, here is the dashboard I've created.
- Data Visualization using Tableau - Visual Analytics and Insights into water quality affected habitations in India as of 2012
Summarizes job descriptions in the form of keywords that would assist job-seekers.
Solucionando la falta de datos abiertos para entender lo que vive la mujer mexicana en el 2021 mediante una página web con visualiación de datos.
Este proyecto se creó con la intención de concientizar sobre la aceptación a la violencia de género en distintos paises, con esto podemos identificar a los grupos con mayor acepatción.
Check dashboards for consistency with your organization's style standards. Receive Slack alerts or test files locally to help enforce dashboard style standards.
I have developed a dashboard that displays the directory path of objects on Tableau Online.
Baseline framework for accessing Julia's computational power from Tableau using the Tableau Analytics Extension API.
Dashboard extension that varies parameter values to animate a viz or tell a story, ala the pages control.
Use this Tableau dashboard to evaluate your investment strategies for an equity portfolio.
Import PowerPoint slides or other images to create Tableau Stories, merging static and dynamic content to make better presentations.
Create PDFs from multiple Tableau Server views, setting parameters and filters, to create multi-page reports or handouts.
Analytic extension that splits separates multi-valued cells in Prep flows into normalized tables.
COVID cases have disproportionally affected low income and minority neighborhoods. We made a webapp to visualize this, as well as other points like infection rate.