-
-

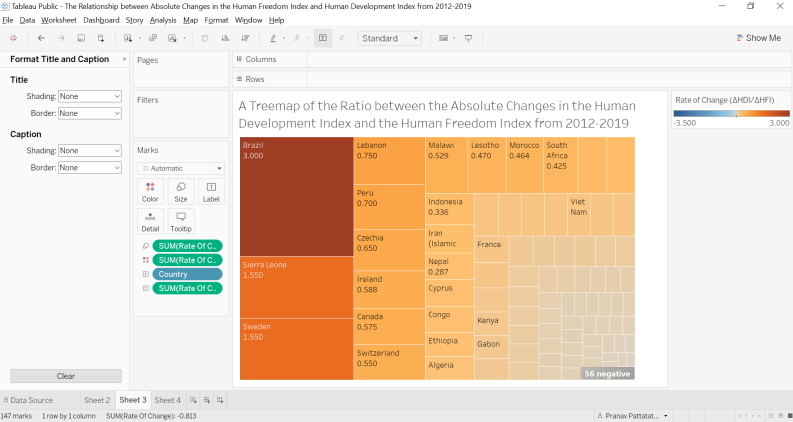
A Treemap of the Ratio between the Absolute Changes in the Human Development Index and the Human Freedom Index from 2012-2019
-
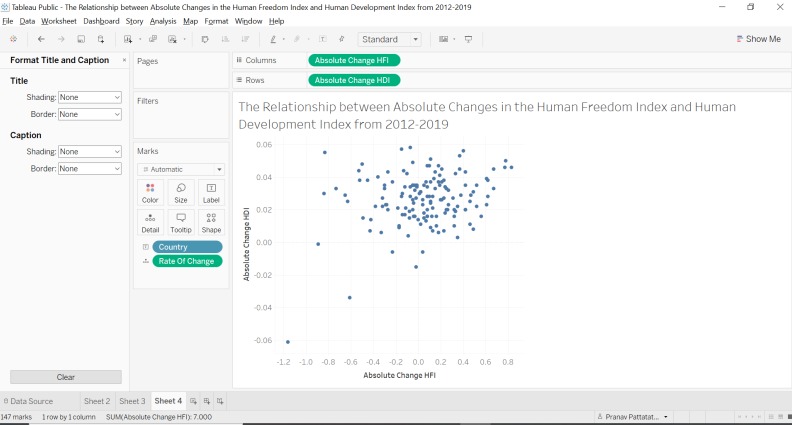
The Relationship between Absolute Changes in the Human Freedom Index and Human Development Index from 2012-2019
-
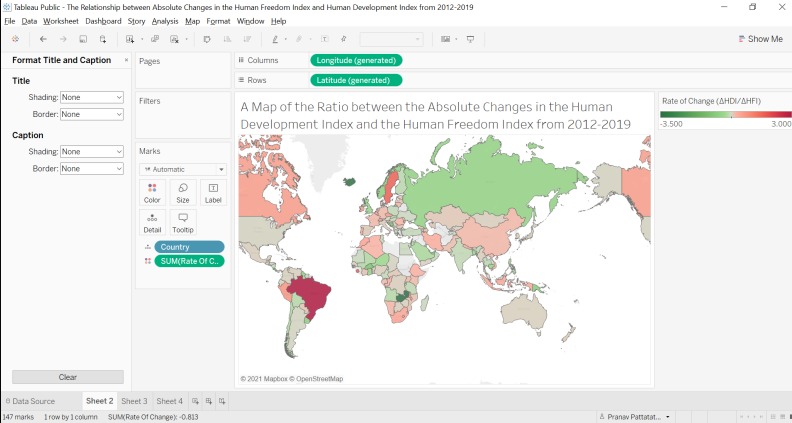
A Map of the Ratio between the Absolute Changes in the Human Development Index and the Human Freedom Index from 2012-2019
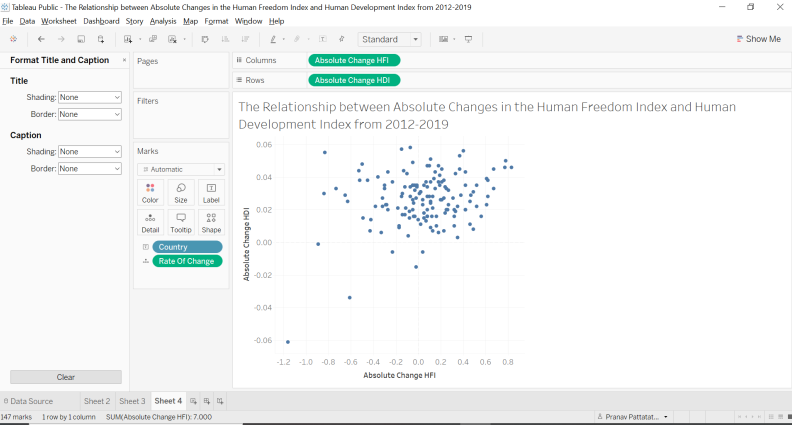

Our team aims to visualize the relationship between the absolute changes in Human Development Index (HDI) and the Human Freedom Index (HFI) of each nation from 2013-2019 to foreshadow the levels of vulnerability for populations of different countries during times of social justice restriction such as during the ongoing Coronavirus pandemic. Since we're all working from home, we were inspired by the work that the Coronavirus Visualization Team has accomplished digitally over the past year and we wanted to use Vizathon as an opportunity to add on to their legacy while also resonating our team's unique perspectives. Throughout Vizathon, we have learned how to export online datasets, utilize R-Studio to code for the correlation between absolute changes in HDI and HFI, and represent these datasets through interactive visualizers. Our team aspires to create simple yet effective visualizations to promote the general welfare of both domestic & international communities all over the world.

Log in or sign up for Devpost to join the conversation.