-
-
Vulnerability assesment

Inspiration
We wanted to learn visualization and interpret data.
What it does
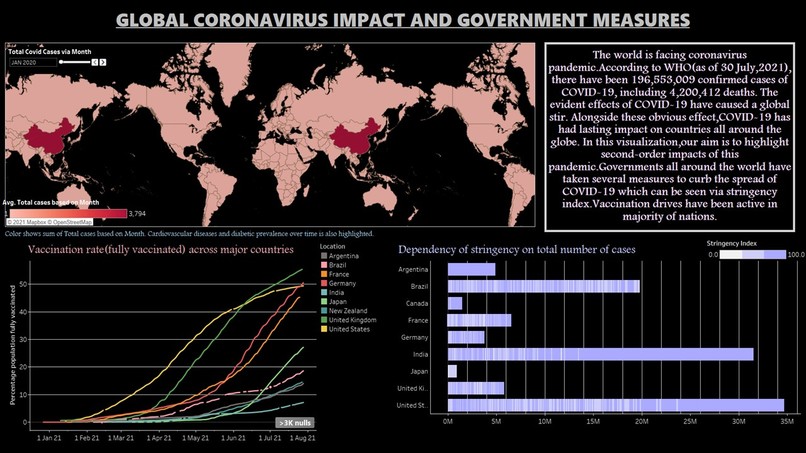
Our project visualizes monthly Covid cases across the globe and also the stringency measures and vaccinated population for major countries.
How we built it
Our project is completely built on Tableau public.
Challenges we ran into
This is our first hackathon, so we ran into various problems.
- We could not understand the projects, the mentors were helpful and prompt and resolved this issue through the Discord community.
- We faced challenges while making the monthly Covid case slider. We eventually figured this out.
- Also data collection was tricky, there were plenty of null values, mismatched values. After working on a real-world dataset now we understand how challenging it can be to work with data.
Accomplishments that we're proud of
Successfully completing this project is a great accomplishment for us. We did not give up although we faced many challenges.
What we learned
We learned how to use Tableau Public. From creating graphs to maps, from adding trend lines to highlighting actions.
What's next for Public Health Track(Challenge 2)
We will continue learning, and keep an eye out for other such interesting challenges. project github link- https://github.com/RaghuMadhavTiwari/VIZATHON


Log in or sign up for Devpost to join the conversation.