-
COVID-19 Dashboard
Inspiration
To know the daily rise in COVID - 19 cases.
What it does
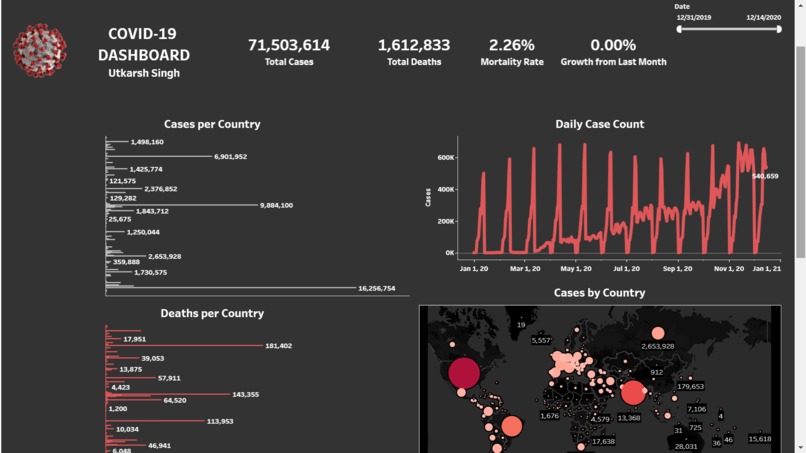
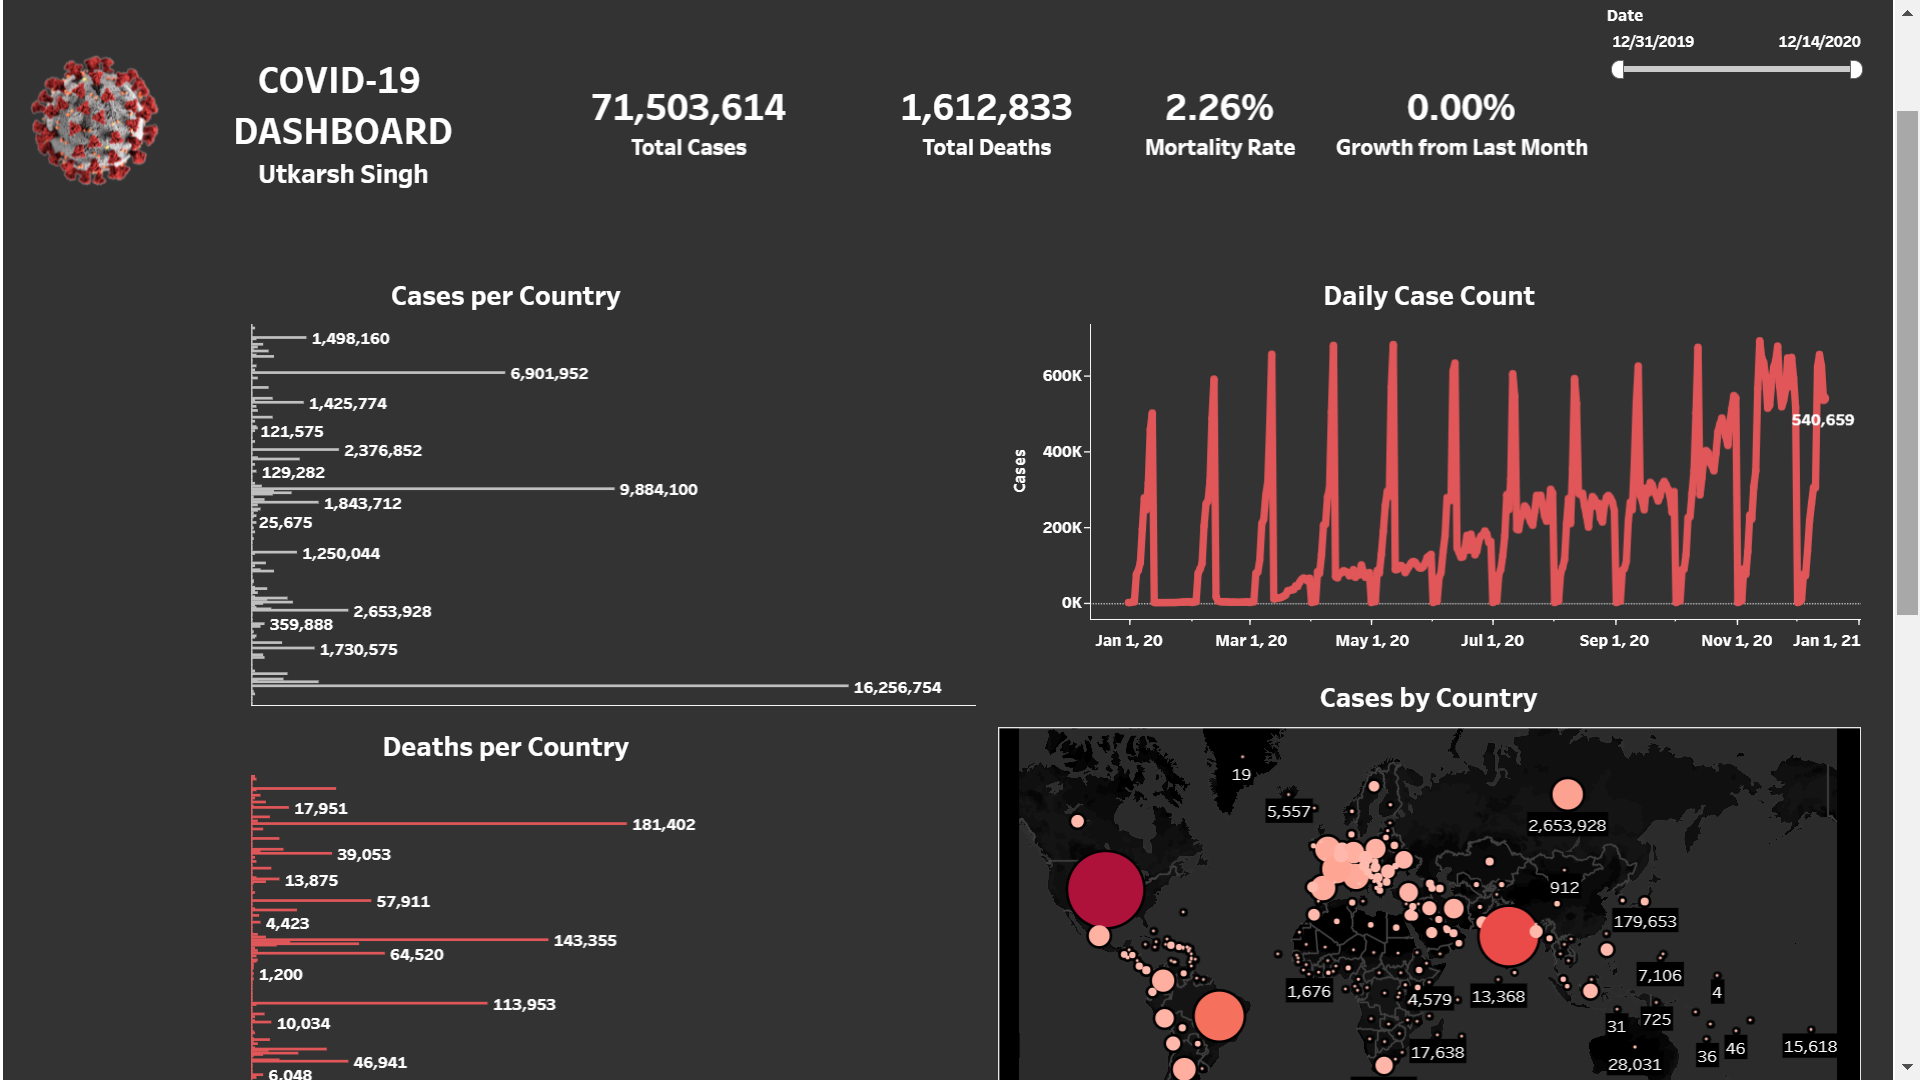
This dashboard has been built using tableau which tells the number of cases increasing or decreasing across the globe through graphs and charts.
How we built it
With the help of tableau
Challenges we ran into
Creating the Excel sheets to represent the various data
Accomplishments that we're proud of
Successfully built my dashboard
What we learned
- Learn how to use tableau to build a dashboard like this.
- Successfully completed Day 3 Data Visualization challenge of MLH: INIT 2022 hackathon. ## What's next for COVID-19 Dashboard This dashboard needs to be updated.
Built With
- msexcel
- tableau

Log in or sign up for Devpost to join the conversation.