-

Interactive dashboard
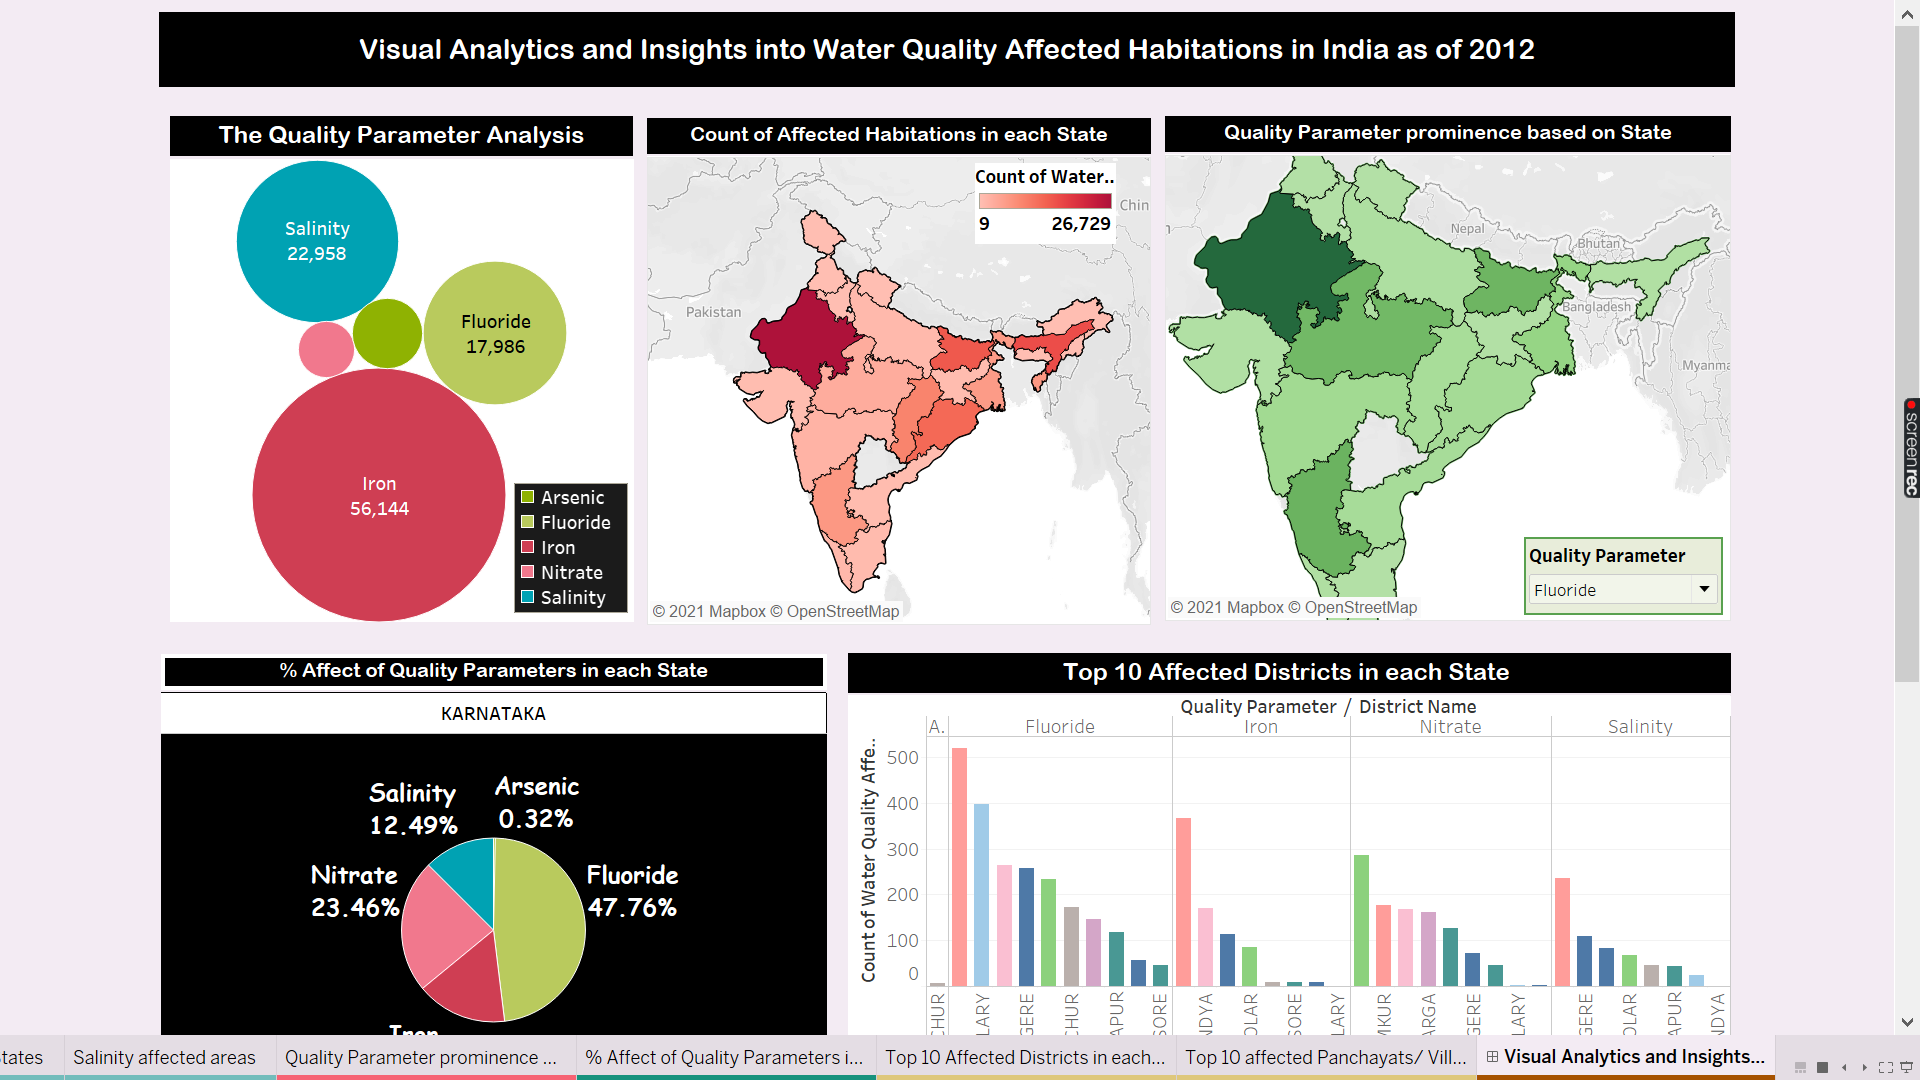
What it does
It gives insights into different parameters that are affecting water quality in India.
How we built it
Using Tableau
Challenges we ran into
Finding an appropriate dataset.
Accomplishments that we're proud of
Beautiful dashboards and stories
What we learned
Data visualization using Tableau
What's next for Visual Insights into water quality affected habitations
Building a model


Log in or sign up for Devpost to join the conversation.