How we built it
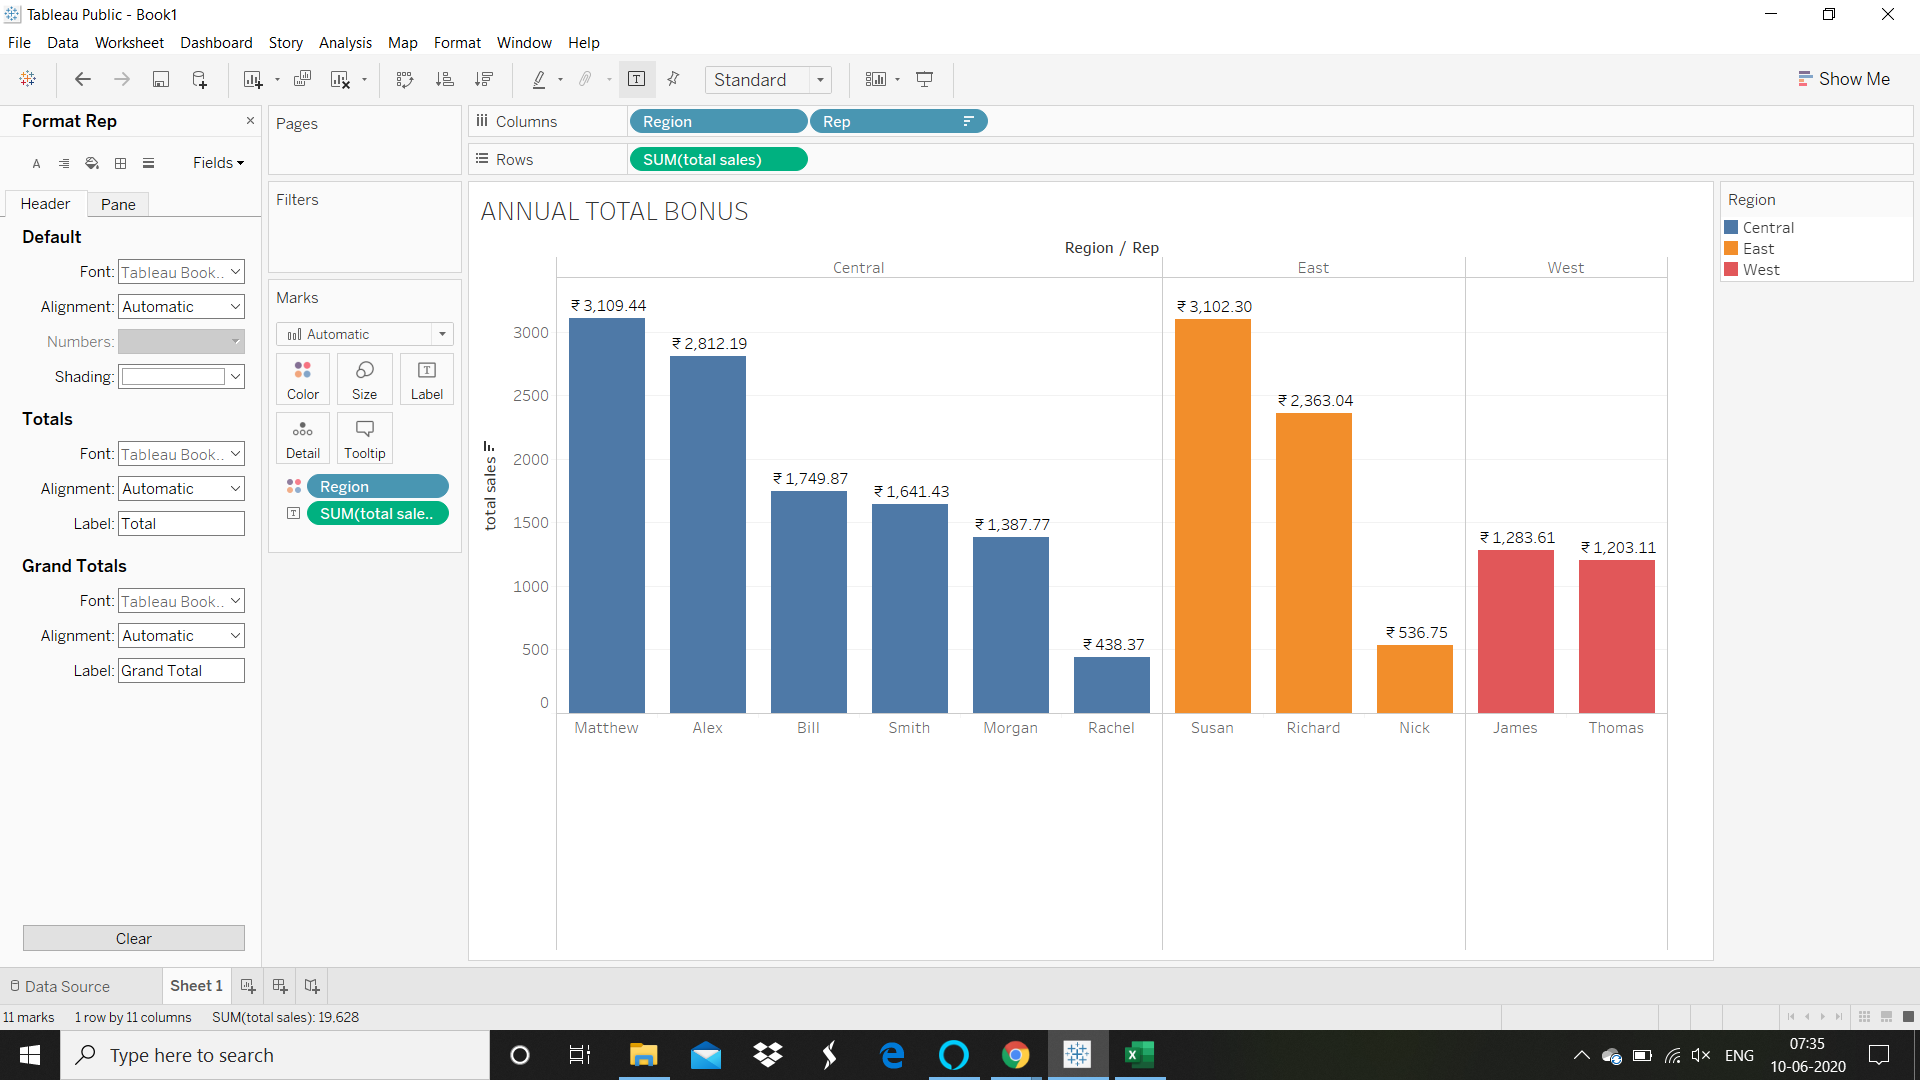
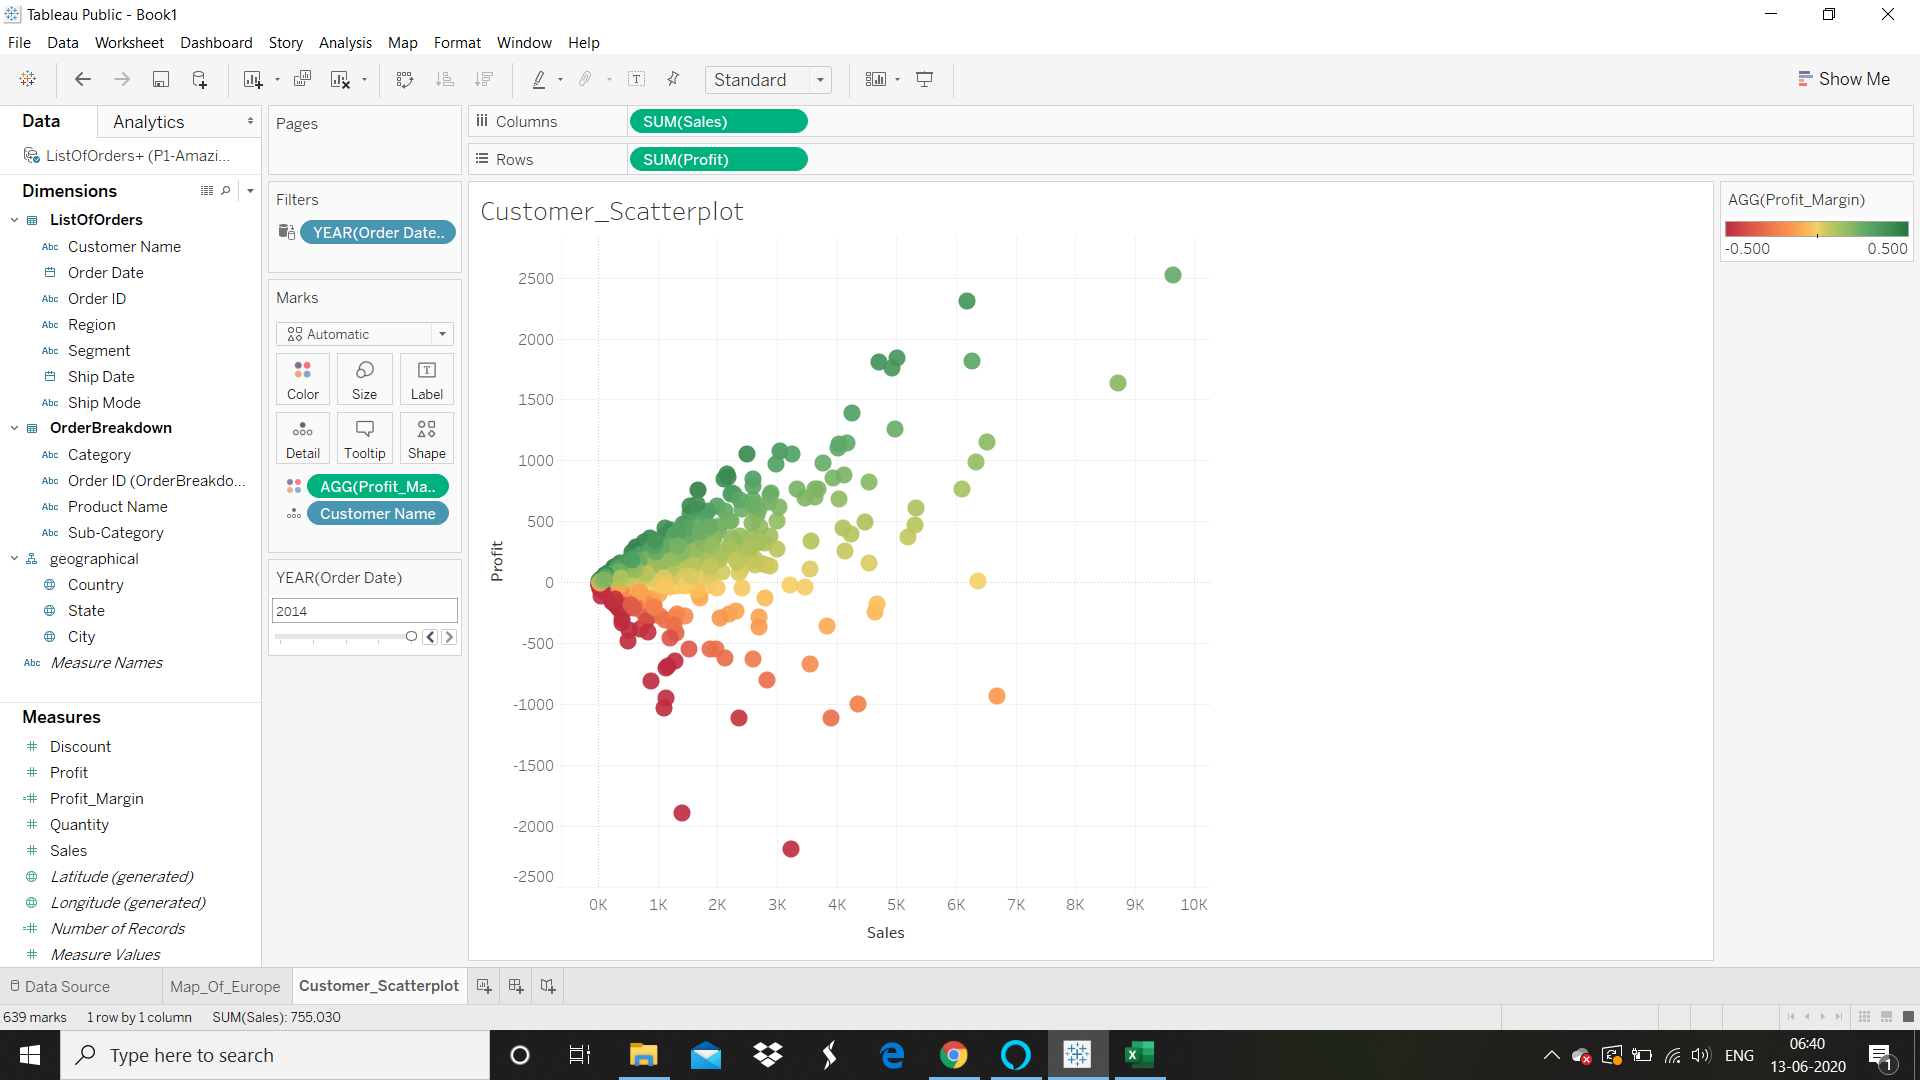
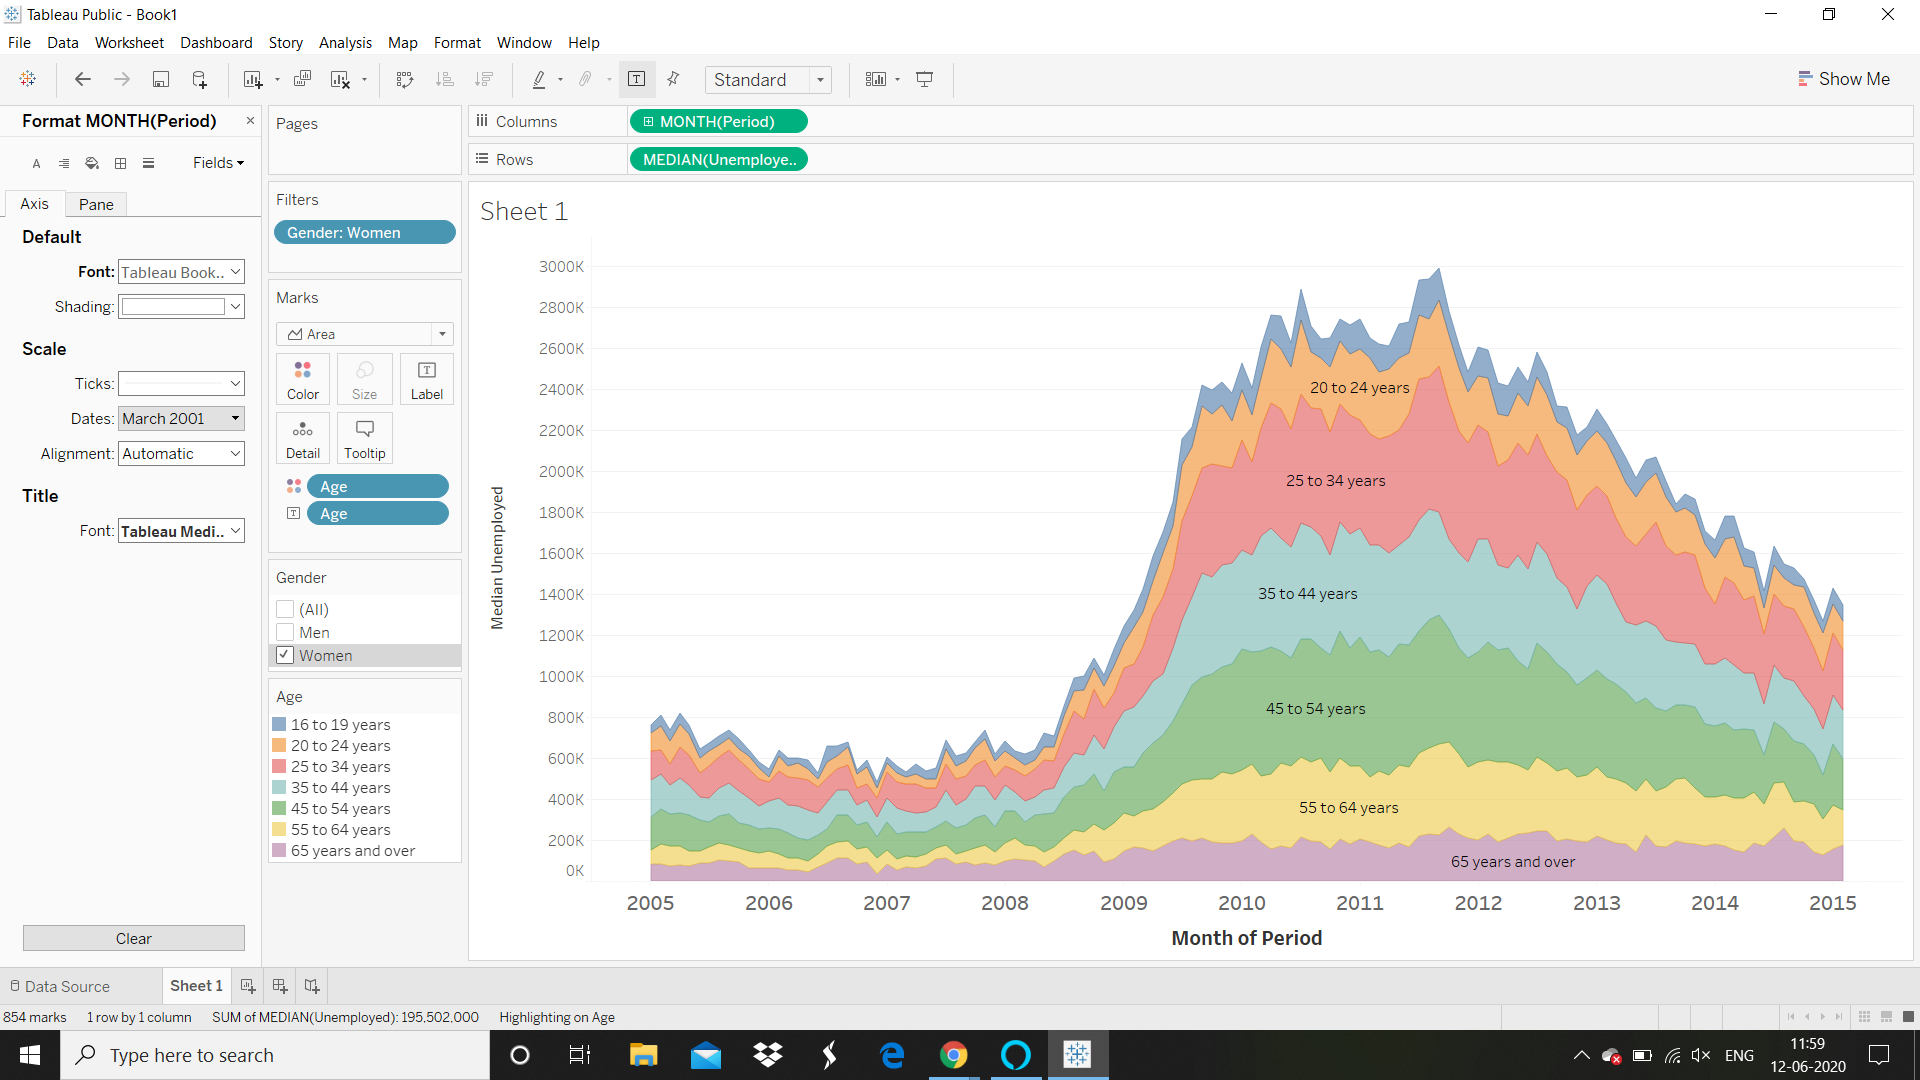
I built it using RAWGraphs , an online data visualization site and Tableau. I collected employee data set from kaggle and visualized on the RAWGraphs site & Tableau.
Challenges we ran into
It was a little confusing at first to understand different types of graphs but I had a fun time playing with different graphs.
Accomplishments that we're proud of
Happy to say I started understanding how to make raw data more useful
Resources
Built With
- data
- kaggle
- rawgraphs
- tableau

Log in or sign up for Devpost to join the conversation.