Devpost
Participate in our public hackathons
Devpost for Teams
Access your company's private hackathons
Grow your developer ecosystem and promote your platform
Drive innovation, collaboration, and retention within your organization
By use case
Blog
Insights into hackathon planning and participation
Customer stories
Inspiration from peers and other industry leaders
Planning guides
Best practices for planning online and in-person hackathons
Webinars & events
Upcoming events and on-demand recordings
Help desk
Common questions and support documentation
Sort by:
The NEW and IMPROVED TAMU Parking Map
Research & Analysis marketing campaign.
Analysis Visualization for IOS Apps
Forgotten America - How a Conflation of Social, Economic, and Health Challenges are Crippling Eastern Kentucky
With healthcare dataset and external data, we deployed a practical tool to visualize and predict the disease counts. Using this tool on a county-level, effective policy decisions can be made.
Looking at app data, how can we predict the types of apps people use?
Using the Social Vulnerability Index (SVI) from the CDC, we've created an interactive dashboard that shows how NC tracts have become more and less vulnerable to social disasters from year-to-year.
How did counties with high Social Vulnerability Indexes fare during the COVID-19 pandemic compared to less vulnerable counties? Did these counties receive enough federal aid?
Explore the relationship between percent uninsured and other factors
In our project, we analyze the dataset of the uninsured population by the state and conduct linear regression analysis to better understand the current situation and its related factors.
An analysis of SVI in relation to national disasters and COVID, and insights to improve emergency response.
We do not simply visualize data. We do real things with data! We want to minimize the unbearable cost natural disasters imposed on human beings by calculating the optimized emergency shelter location.
Get your favorite things, touch-free!
Prevent breaking changes. Due diligence for Data Teams.
Analyzing collision data to predict the attributes that contribute to a fatal collision and educate drivers based on the findings.
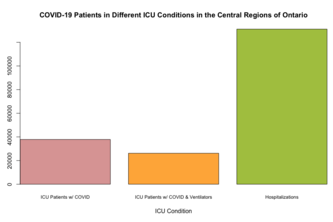
Welcome to my project on Ventilators and the Healthcare Crisis! It explores data from the CDC and the government of Ontario, RStudio, Tableau, and key findings from putting everything together!
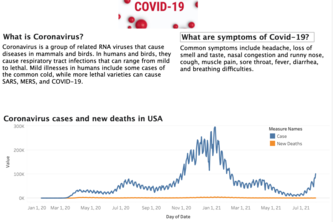
We demonstrate covid new deaths and cases in USA
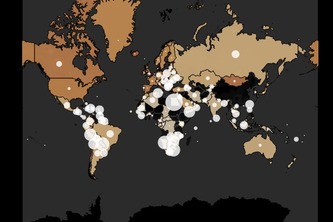
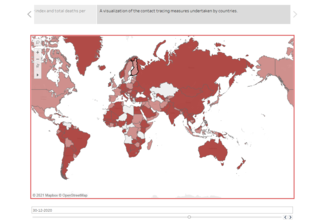
Initially, we just wanted to know how bad the situation is in our country India, as compared to other countries as we had high numbers of confirmed cases.
Direct Effects of Race/Ethnicity by COVID-19
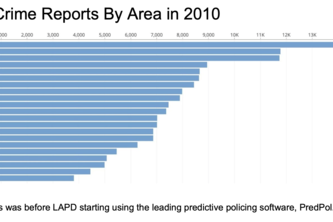
In our project, we looked at a crime dataset from LAPD and considered the effect PredPol, a predictive policing software, may have had on crime rates following its introduction.
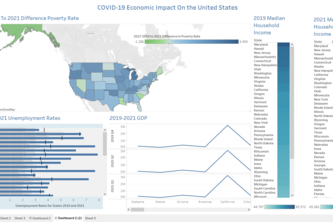
This project visualizes the economic impacts of the pandemic on a state-by-state basis in the United States. We analyzed poverty rates, state GDP, unemployment rates, and median household income.
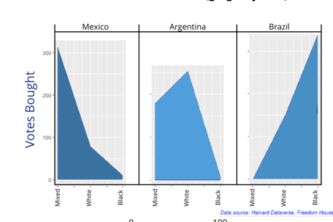
The failure of democracy from a global perspective, specifically regarding Latin America, the US, and European nations; attempting to visualize data regarding vote buying, democratic strength, etc.
COVID-19 has disrupted our daily lives from academia to the workplace. Here we took the challenge of telling the story of unemployment in 3 data visualizations!
Let the dataset change your mindset - Hans Rosling