Devpost
Participate in our public hackathons
Devpost for Teams
Access your company's private hackathons
Grow your developer ecosystem and promote your platform
Drive innovation, collaboration, and retention within your organization
By use case
Blog
Insights into hackathon planning and participation
Customer stories
Inspiration from peers and other industry leaders
Planning guides
Best practices for planning online and in-person hackathons
Webinars & events
Upcoming events and on-demand recordings
Help desk
Common questions and support documentation
Sort by:
Apply consistent and customizable styling to the dashboard components and unify the visual language of your visualization.
The data set is based on high school students, however, the project is relevant to college students because high school and college students must abide by similar rules.
Clients need to conduct a hypothesis test on group differences. The strategic planning will depend on whether there exist statistically significant differences between groups.
Using the Netflix dataset from Kaggle to visualize the countries which have certain movies.
The Digital Education Monitor enables people to learn which projects are active, what their challenges are and much more, with an data-driven approach and intuitive to analytics tools.
An evaluation of a dataset that measures the COVID-19 impact on the Global Economy
Evolutionary analysis of various Coronavirus genomes to better predict future epidemics.
Comparison of crime data and its correlated factors across India and US to find the underlying trend in the data.
Data Visualization showing Sales and popularity of the Restaurants
A website that report hate crimes, provide resources to learn more about hate crimes, and stop them from happening!
One-Stop Smart Solution for Sacramento Residents
Space Data made visual! A public Scientific Space Alliance amongst space enthusiasts for the affinity of inter-planetary interests, the nature of space, and qualities amongst scientific data
This map will show Mhani Gingi's incredible impact and provide opportunity for people to support their efforts with funds.
Our project consists of three main components - an XGBoost machine learning model, a map, and Tableau visualizations. These three components are a powerful set of tools for Chevron stores.
Team DataDoctors insights on access to quality healthcare and what we believe to be its future, telemedicine.
Using People Counters to Predict Refills?
We are a non-profit organization since opening in 2020, we provide information and service on water saving to the public.
Your place to compare procedure costs and quality across hospitals.
After almost a year of Covid, the news of the vaccine was a 'light at the end of the tunnel' to most people. We wanted to make that light brighter by creating a vaccinations dashboard.
See CO2, like never before.
Find out if your favorite singer is one of the top streamed artists this week!
a map of airbnb listings in LA in may 2020
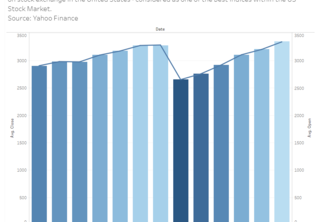
Graph that presents the Stock Market Index S&P 500 that measures the stock performance of the 500 large companies on the stock exchange in the US.
Your best buddy on the job-hunting journey!