-
-
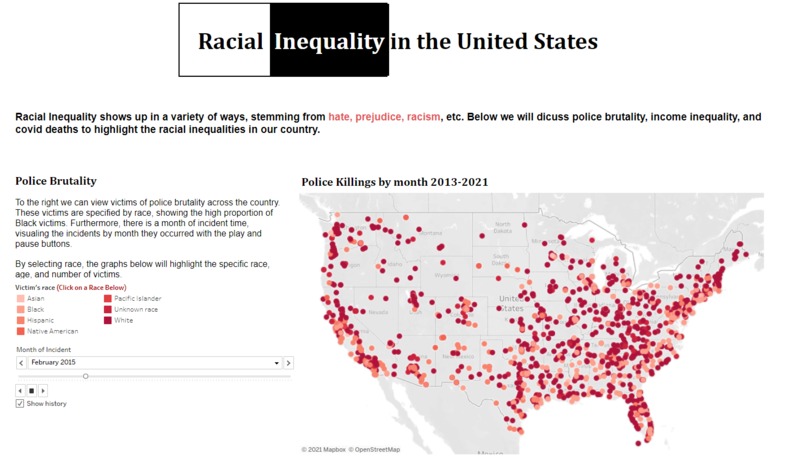
Social Justice Data-Viz
-
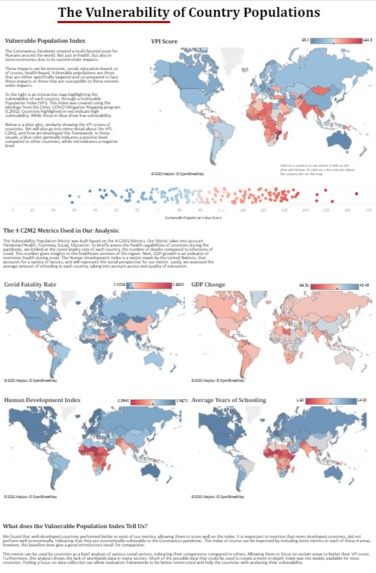
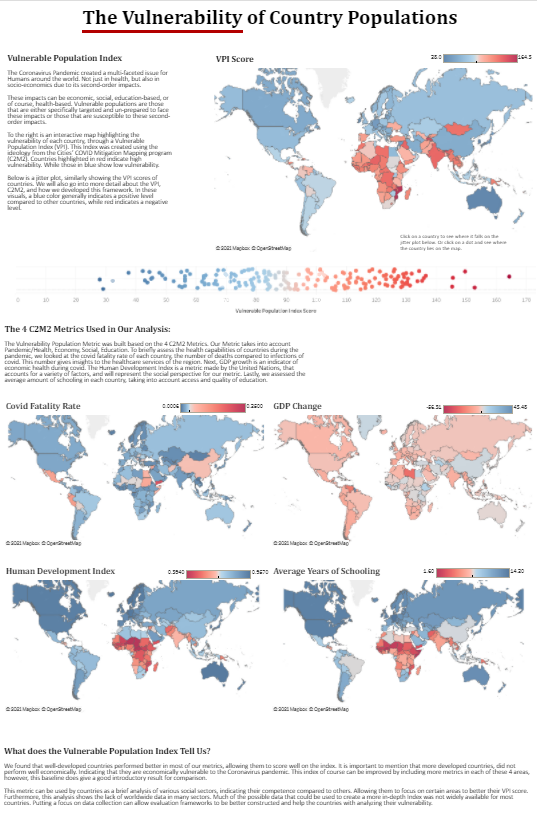
Challenge #2 Data-Viz

Inspiration
Hello everyone, this project and these 2 data visualization projects have been created by Abhiram and Anirudh Vetukuri. We are high schoolers from Shrewsbury, MA and are extremely excited to share our vizzes with the judges and other participants. We focused on finding the best “visualizable” datasets to create really interactive and interconnected graphs in our submissions. I hope everyone enjoys exploring the graphs and learning about these important topics.
Here is a link to all of our data sources:
https://docs.google.com/spreadsheets/d/1dKmaV_JiWcG8XBoRgP8b4e9Eopkpgt7FL7nyspvzAsE/edit#gid=0
https://www.census.gov/data/tables/time-series/demo/income-poverty/cps-pinc.html
http://hdr.undp.org/en/content/download-data
https://github.com/CSSEGISandData/COVID-19
https://data.worldbank.org/indicator/NY.GDP.MKTP.KD.ZG
how you built your project
We built our project using Tableau and really gained familiarity with the software after this viz-a-thon.
challenges you faced
Faced a lot of challenges with working with software I am not really familiar with, and trying to find the best data for my visualizations.
Log in or sign up for Devpost to join the conversation.